## Line Chart: Accuracy vs. Thinking Compute for Different Methods
### Overview
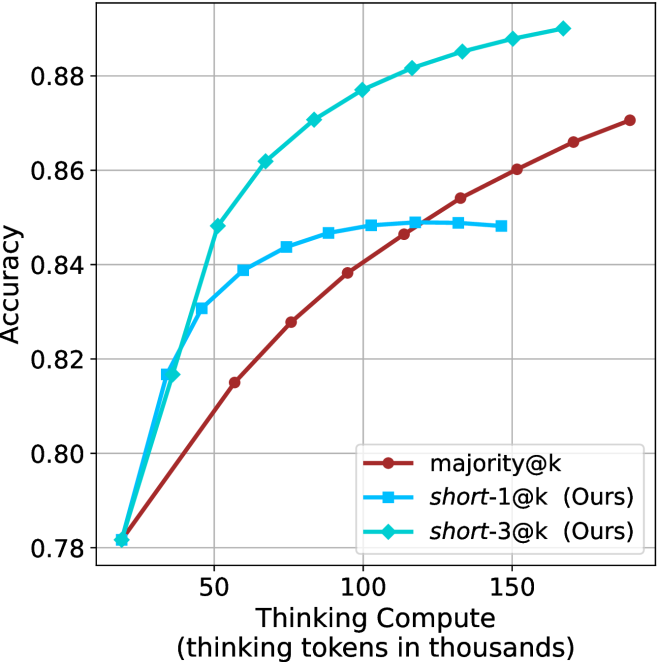
This image is a line chart comparing the performance (accuracy) of three different methods as a function of computational resources ("Thinking Compute"). The chart demonstrates how accuracy scales with increased compute for a baseline method and two proposed methods labeled "(Ours)".
### Components/Axes
* **X-Axis (Horizontal):**
* **Label:** `Thinking Compute (thinking tokens in thousands)`
* **Scale:** Linear scale from approximately 0 to 180 (thousands of tokens).
* **Major Ticks:** 50, 100, 150.
* **Y-Axis (Vertical):**
* **Label:** `Accuracy`
* **Scale:** Linear scale from 0.78 to approximately 0.89.
* **Major Ticks:** 0.78, 0.80, 0.82, 0.84, 0.86, 0.88.
* **Legend:**
* **Position:** Bottom-right corner of the chart area.
* **Entries:**
1. `majority@k` - Represented by a dark red line with circular markers.
2. `short-1@k (Ours)` - Represented by a medium blue line with square markers.
3. `short-3@k (Ours)` - Represented by a cyan/turquoise line with diamond markers.
### Detailed Analysis
The chart plots three distinct data series. The general trend for all is increasing accuracy with increased thinking compute, but the rate and ceiling differ significantly.
**1. Data Series: `majority@k` (Dark Red, Circles)**
* **Trend:** Shows a steady, near-linear upward slope across the entire compute range. It starts as the lowest-performing method at low compute but continues to improve without obvious plateauing within the chart's bounds.
* **Approximate Data Points:**
* At ~10k tokens: Accuracy ≈ 0.78
* At ~50k tokens: Accuracy ≈ 0.815
* At ~100k tokens: Accuracy ≈ 0.838
* At ~150k tokens: Accuracy ≈ 0.860
* At ~180k tokens: Accuracy ≈ 0.870 (estimated, line extends past last tick)
**2. Data Series: `short-1@k (Ours)` (Blue, Squares)**
* **Trend:** Shows a rapid initial increase in accuracy at low compute, followed by a clear plateau. The curve flattens significantly after approximately 75k-100k thinking tokens, indicating diminishing returns.
* **Approximate Data Points:**
* At ~10k tokens: Accuracy ≈ 0.78 (similar starting point to others)
* At ~50k tokens: Accuracy ≈ 0.839
* At ~75k tokens: Accuracy ≈ 0.846
* At ~100k tokens: Accuracy ≈ 0.848
* At ~125k tokens: Accuracy ≈ 0.848 (plateau)
* At ~150k tokens: Accuracy ≈ 0.848 (plateau)
**3. Data Series: `short-3@k (Ours)` (Cyan, Diamonds)**
* **Trend:** Exhibits the steepest initial ascent and achieves the highest overall accuracy. It continues to show meaningful improvement across the entire plotted range, though the rate of increase slows slightly at higher compute levels.
* **Approximate Data Points:**
* At ~10k tokens: Accuracy ≈ 0.78
* At ~50k tokens: Accuracy ≈ 0.848
* At ~75k tokens: Accuracy ≈ 0.862
* At ~100k tokens: Accuracy ≈ 0.877
* At ~125k tokens: Accuracy ≈ 0.882
* At ~150k tokens: Accuracy ≈ 0.885
* At ~175k tokens: Accuracy ≈ 0.888 (estimated)
### Key Observations
1. **Performance Hierarchy:** At virtually all compute levels above the initial point, `short-3@k (Ours)` > `short-1@k (Ours)` > `majority@k`.
2. **Efficiency:** The proposed methods (`short-1@k` and `short-3@k`) are significantly more compute-efficient. For example, to reach an accuracy of 0.84, `short-3@k` requires ~45k tokens, `short-1@k` requires ~60k tokens, while `majority@k` requires ~110k tokens.
3. **Plateau Behavior:** `short-1@k` plateaus around 0.848 accuracy. `short-3@k` shows no clear plateau within the chart, suggesting it may benefit from even more compute. `majority@k` shows no plateau but remains less efficient.
4. **Convergence at Low Compute:** All three methods start at nearly the same accuracy (~0.78) when thinking compute is very low (~10k tokens).
### Interpretation
This chart presents a classic efficiency-performance trade-off analysis in machine learning or AI system design. The data suggests that the authors' proposed methods (`short-1@k` and `short-3@k`) are superior to the baseline (`majority@k`) in terms of the accuracy achieved per unit of computational cost (thinking tokens).
* **`short-3@k`** is the most effective method, offering the highest accuracy ceiling and strong scaling. It is the recommended choice when maximum performance is the goal and compute is available.
* **`short-1@k`** offers a good balance, providing a substantial boost over the baseline with moderate compute but hitting a performance limit. It might be suitable for resource-constrained environments where the additional gain from `short-3@k` is not justified.
* **`majority@k`** serves as a simple baseline. Its linear scaling indicates it is a robust but inefficient method, requiring disproportionate compute for gains in accuracy.
The underlying message is that the authors' techniques ("Ours") enable more accurate results with less computational waste, which is critical for scaling AI models efficiently. The plateau of `short-1@k` versus the continued rise of `short-3@k` might indicate differences in model capacity or the effectiveness of the "short" strategy at different scales.