## Diagram: Grid Transformation Process
### Overview
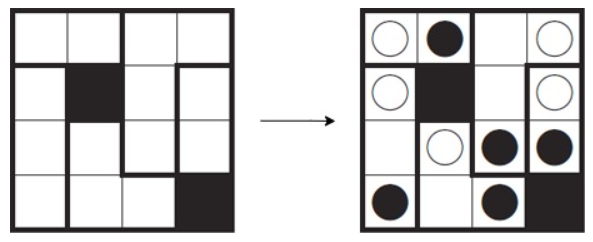
The image depicts a two-step visual transformation between two 4x4 grid structures. The left grid contains black squares in specific positions, while the right grid replaces these with black circles in altered positions. A black arrow indicates a directional relationship from left to right.
### Components/Axes
- **Left Grid**:
- 4x4 grid of white squares.
- Black squares located at:
- Row 2, Column 2
- Row 4, Column 4
- **Right Grid**:
- 4x4 grid of white squares.
- Black circles located at:
- Row 1, Column 2
- Row 2, Column 4
- Row 3, Column 3
- Row 4, Column 1
- **Arrow**:
- Black arrow pointing from the left grid to the right grid, positioned centrally between the two grids.
### Detailed Analysis
- **Left Grid**:
- Two black squares occupy diagonal positions (2,2) and (4,4).
- All other squares are white.
- **Right Grid**:
- Four black circles occupy positions (1,2), (2,4), (3,3), and (4,1).
- No overlapping or adjacent black circles.
- **Arrow**:
- Positioned horizontally between the two grids, aligned with the center of the grids.
### Key Observations
1. The transformation replaces black squares with black circles.
2. The positions of the black elements shift significantly:
- Original square at (2,2) → circle at (1,2) (up one row).
- Original square at (4,4) → circle at (3,3) (diagonal shift).
- Additional circles appear at (2,4) and (4,1), not present in the original grid.
3. No textual labels, legends, or axis markers are present.
### Interpretation
The diagram illustrates a positional transformation of elements from squares to circles, with a non-trivial rearrangement of their locations. The absence of textual labels suggests the transformation is purely visual or symbolic, possibly representing a process like data encoding, state transition, or pattern reconfiguration. The diagonal and orthogonal shifts imply a systematic rule governing the movement of elements, though the exact logic is not explicitly defined in the image. The use of circles instead of squares may indicate a change in data type or representation (e.g., from discrete to continuous values).