## Learning Method Comparison: Confounded vs. Interventional
### Overview
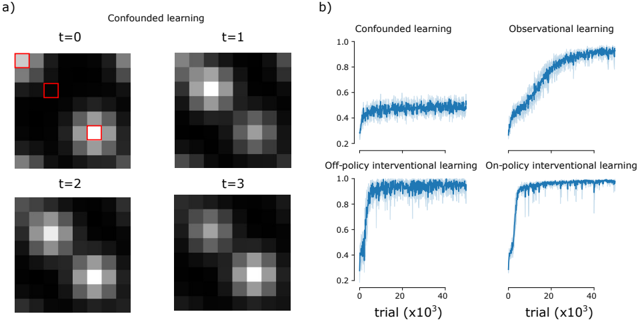
The image presents a comparison of different learning methods, including confounded learning, observational learning, and interventional learning (both off-policy and on-policy). Part (a) shows a sequence of images representing confounded learning at different time steps (t=0 to t=3). Part (b) displays line graphs illustrating the performance of each learning method over trials.
### Components/Axes
**Part a)**
* **Title:** Confounded learning
* **Images:** Four grayscale images arranged in a 2x2 grid, labeled t=0, t=1, t=2, and t=3. Each image is a grid of pixels, with varying shades of gray. In the t=0 image, there are three red squares highlighting specific regions.
**Part b)**
* **Title:** Comparison of Learning Methods
* **X-axis:** trial (x10^3), ranging from 0 to 40.
* **Y-axis:** Performance (unlabeled, but implied), ranging from 0 to 1.0, with tick marks at 0.2, 0.4, 0.6, 0.8, and 1.0.
* **Graphs:** Four line graphs, each representing a different learning method:
* Confounded learning
* Observational learning
* Off-policy interventional learning
* On-policy interventional learning
### Detailed Analysis
**Part a) Confounded Learning Images:**
* **t=0:** A grid of grayscale pixels. Three red squares highlight specific regions. One is in the top-left corner, one is slightly below and to the right of the first, and the third is in the lower-center.
* **t=1:** Two bright spots appear in the image, one in the upper-right and one in the lower-left.
* **t=2:** The bright spots become more defined and pronounced.
* **t=3:** The bright spots are further refined and more clearly visible.
**Part b) Performance Graphs:**
* **Confounded learning:** The blue line rises sharply from approximately 0.2 to about 0.5 within the first 5000 trials, then plateaus and fluctuates around 0.5 for the remaining trials.
* **Observational learning:** The blue line starts near 0.2 and gradually increases to approximately 0.95 by the end of the 40,000 trials. The line shows a steady upward trend.
* **Off-policy interventional learning:** The blue line rises sharply from approximately 0.2 to about 0.9 within the first 5000 trials, then fluctuates around 0.9 for the remaining trials.
* **On-policy interventional learning:** The blue line rises sharply from approximately 0.2 to about 0.95 within the first 5000 trials, then fluctuates around 0.95 for the remaining trials.
### Key Observations
* Confounded learning plateaus at a relatively low performance level.
* Observational learning shows a gradual but consistent improvement over trials.
* Both off-policy and on-policy interventional learning methods achieve high performance levels quickly.
* Interventional learning methods appear to outperform confounded and observational learning in this scenario.
### Interpretation
The data suggests that interventional learning methods are more effective than confounded or observational learning in this particular context. Confounded learning seems to be limited in its ability to improve performance, while observational learning shows gradual improvement but does not reach the same high performance levels as interventional learning. The rapid increase in performance for both off-policy and on-policy interventional learning indicates that these methods are able to quickly learn and adapt to the task. The red squares in the confounded learning images at t=0 might be highlighting areas of interest or potential confounds that the learning algorithm is struggling with.