TECHNICAL ASSET FINGERPRINT
4585589b75fb723fb1270a21
Click to view fullscreen
Press ESC or click to close
FOUND IN PAPERS
EXPERT: healer-alpha-free VERSION 1
RUNTIME: free/openrouter/healer-alpha
INTEL_VERIFIED
## [Multi-Panel Figure]: Learning Dynamics in Confounded vs. Interventional Settings
### Overview
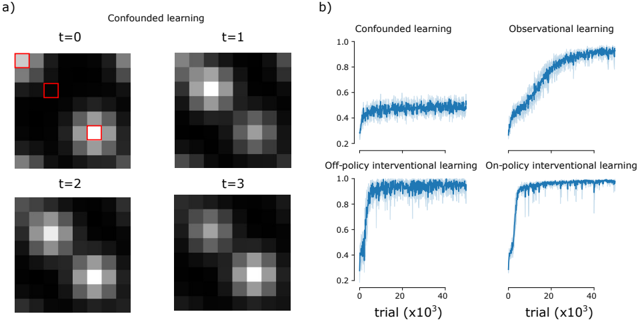
The image is a two-part scientific figure (labeled a) and b)) comparing different learning paradigms. Part a) visualizes the evolution of a spatial probability distribution over time under "Confounded learning." Part b) presents four line graphs quantifying learning performance (y-axis) across trials (x-axis) for four distinct learning conditions.
### Components/Axes
**Part a) - Heatmap Sequence:**
* **Title:** "Confounded learning"
* **Panels:** Four square heatmap panels arranged in a 2x2 grid.
* **Time Labels:** Each panel is labeled with a time step: `t=0`, `t=1`, `t=2`, `t=3`.
* **Visual Elements:** Each panel is a grayscale heatmap (darker = lower value, brighter = higher value). At `t=0`, three specific bright regions are highlighted with red square outlines. These highlights are absent in subsequent panels (`t=1`, `t=2`, `t=3`).
**Part b) - Line Charts:**
* **Layout:** Four line charts arranged in a 2x2 grid.
* **Chart Titles (Top of each subplot):**
* Top-left: `Confounded learning`
* Top-right: `Observational learning`
* Bottom-left: `Off-policy interventional learning`
* Bottom-right: `On-policy interventional learning`
* **X-axis (Common to all four charts):** Labeled `trial (x10³)`. The scale runs from 0 to 40, with major ticks at 0, 20, and 40. This represents trials in thousands (0 to 40,000).
* **Y-axis (Common to all four charts):** Unlabeled but represents a performance metric (e.g., accuracy, reward). The scale runs from 0.0 to 1.0, with ticks at 0.2 intervals (0.0, 0.2, 0.4, 0.6, 0.8, 1.0).
* **Data Series:** Each chart contains a single blue line representing the mean performance, surrounded by a lighter blue shaded area representing variance or confidence intervals.
### Detailed Analysis
**Part a) - Confounded Learning Heatmaps:**
* **t=0:** The heatmap shows three distinct, localized bright spots (high-value regions) against a dark background. These are explicitly highlighted by red squares. Their approximate positions are: top-left quadrant, center-left, and lower-center.
* **t=1:** The bright regions have begun to spread and merge. The distinct spots from t=0 are less defined, forming a more connected, amorphous bright area in the center and lower-right.
* **t=2:** The bright area has consolidated further, forming a large, dominant bright region in the lower-right quadrant, with a smaller secondary region in the upper-left.
* **t=3:** The pattern is similar to t=2 but appears slightly more diffuse. The primary bright region remains in the lower-right.
**Part b) - Performance Charts:**
1. **Confounded learning (Top-left):**
* **Trend:** The line rises quickly from ~0.2 to a plateau around 0.5 within the first 5,000 trials. It remains relatively flat with minor fluctuations for the remainder of the 40,000 trials.
* **Final Value (approx.):** ~0.50 ± 0.05 (mean ± visual estimate of shaded area width).
2. **Observational learning (Top-right):**
* **Trend:** Shows a steady, logarithmic-like increase. It starts near 0.2, rises steeply until ~15,000 trials, then continues to increase at a decelerating rate.
* **Final Value (approx.):** ~0.90 ± 0.05.
3. **Off-policy interventional learning (Bottom-left):**
* **Trend:** Exhibits the fastest initial rise, reaching near-maximum performance (~0.95) within the first 5,000-10,000 trials. After this rapid ascent, it maintains a high, stable plateau with very low variance.
* **Final Value (approx.):** ~0.98 ± 0.02.
4. **On-policy interventional learning (Bottom-right):**
* **Trend:** Similar to its off-policy counterpart but with a slightly less steep initial slope. It reaches a high plateau (~0.95) by approximately 10,000-15,000 trials and remains stable.
* **Final Value (approx.):** ~0.97 ± 0.03.
### Key Observations
* **Performance Hierarchy:** There is a clear ordering in final performance: Confounded learning (~0.5) << Observational learning (~0.9) < On-policy Interventional (~0.97) ≈ Off-policy Interventional (~0.98).
* **Learning Speed:** The interventional methods (both on- and off-policy) learn the fastest, reaching near-optimal performance very early. Observational learning is slower but steady. Confounded learning plateaus early at a sub-optimal level.
* **Variance:** The "Confounded learning" chart shows the highest relative variance (widest shaded area) around its plateau. The interventional methods show very tight variance once converged.
* **Spatial Dynamics (Part a):** The heatmap sequence suggests that under confounding, the agent's internal model or policy (represented by the bright regions) fails to maintain focus on the initially relevant areas (red boxes at t=0) and instead drifts to a suboptimal, consolidated solution.
### Interpretation
This figure demonstrates the critical impact of confounding variables and interventional data on learning efficiency and final performance.
* **Part a)** visually illustrates the failure mode of "confounded learning." The agent starts by identifying multiple potential causes (the three highlighted spots). However, due to confounding—where observed correlations do not reflect true causal relationships—the agent's belief state degrades over time (`t=1` to `t=3`). It converges on a simplified, incorrect model of the environment (the large bright blob), explaining its poor asymptotic performance in part b).
* **Part b)** quantifies the advantage of moving beyond purely observational data. While observational learning performs well, methods that leverage interventional data (where variables are actively manipulated to break spurious correlations) achieve faster convergence and higher final performance. The near-identical performance of off-policy and on-policy interventional learning suggests that for this task, the source of interventional data (logged vs. generated online) is less important than the interventional nature of the data itself.
* **Overall Message:** The data argues that to achieve robust and efficient learning in complex environments, especially those with confounding factors, it is essential to incorporate interventional reasoning or data into the learning process. Relying solely on observational data, or worse, data from a confounded process, leads to suboptimal and potentially incorrect models.
DECODING INTELLIGENCE...