## Heatmaps and Line Graphs: Learning Method Performance Over Time
### Overview
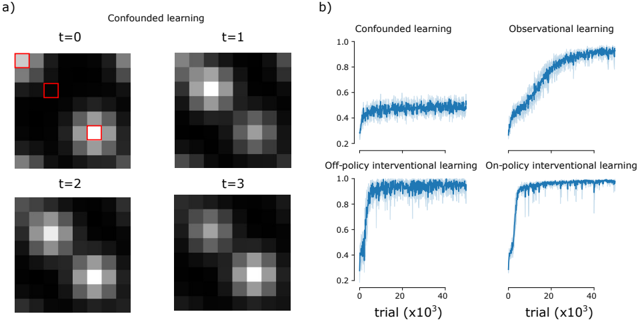
The image presents two sets of visualizations comparing learning methods across time steps and trials. Part **a)** shows four heatmaps labeled **t=0** to **t=3** under "Confounded learning," with red squares highlighting specific regions. Part **b)** displays four line graphs comparing **Confounded learning**, **Observational learning**, **Off-policy interventional learning**, and **On-policy interventional learning** across trials (x10³) with performance metrics on a 0–1 scale.
---
### Components/Axes
#### Part a) Heatmaps
- **Labels**:
- Time steps: **t=0**, **t=1**, **t=2**, **t=3**.
- Title: **"Confounded learning"**.
- **Annotations**:
- Red squares at **t=0** (top-left) and **t=1** (bottom-right), likely indicating regions of interest or anomalies.
- **Spatial Layout**:
- Heatmaps arranged in a 2x2 grid, with **t=0** (top-left), **t=1** (top-right), **t=2** (bottom-left), **t=3** (bottom-right).
#### Part b) Line Graphs
- **Axes**:
- **X-axis**: Trials (x10³), ranging from 0 to 40,000.
- **Y-axis**: Performance metric (0–1.0).
- **Legends**:
- Located on the right, with four lines:
- **Blue**: Confounded learning.
- **Dark blue**: Observational learning.
- **Light blue**: Off-policy interventional learning.
- **Teal**: On-policy interventional learning.
- **Spatial Layout**:
- Four line graphs arranged in a 2x2 grid, with **Confounded** (top-left), **Observational** (top-right), **Off-policy** (bottom-left), **On-policy** (bottom-right).
---
### Detailed Analysis
#### Part a) Heatmaps
- **t=0**:
- Two red squares highlight high-intensity regions: one in the top-left and one in the bottom-right.
- **t=1**:
- Heatmap shows increased intensity in the top-left region, with the red square now centered there.
- **t=2**:
- Intensity shifts to the bottom-left, with a diffuse pattern.
- **t=3**:
- Intensity stabilizes in the bottom-left, with a more uniform distribution.
#### Part b) Line Graphs
1. **Confounded learning** (blue):
- Starts at ~0.4, fluctuates slightly, and plateaus near **0.6** by 40k trials.
2. **Observational learning** (dark blue):
- Begins at ~0.2, rises steadily to **~0.8** by 40k trials, with minor noise.
3. **Off-policy interventional learning** (light blue):
- Sharp rise from ~0.2 to **~0.95** by 20k trials, followed by stabilization with minor oscillations.
4. **On-policy interventional learning** (teal):
- Rapid ascent from ~0.1 to **~1.0** by 20k trials, maintaining near-perfect performance thereafter.
---
### Key Observations
1. **Heatmaps**:
- Red squares at **t=0** and **t=1** suggest shifting focus areas, possibly indicating dynamic attention mechanisms or error correction.
- By **t=3**, the heatmap stabilizes, implying convergence of the learning process.
2. **Line Graphs**:
- **On-policy interventional learning** outperforms all methods, achieving near-perfect performance fastest.
- **Off-policy interventional learning** shows higher variability but still surpasses Confounded and Observational methods.
- **Confounded learning** exhibits the slowest and least stable progress, likely due to confounding variables.
---
### Interpretation
The data demonstrates that **interventional learning methods** (both On-policy and Off-policy) significantly outperform Confounded and Observational approaches. The On-policy method’s rapid convergence suggests it effectively mitigates confounding factors, while the Off-policy method’s fluctuations may reflect challenges in off-policy optimization. The heatmaps in Part a) likely visualize attention or error patterns, with red squares marking critical regions where the model adjusts its focus over time. These results highlight the importance of interventional strategies in environments with confounding variables, offering insights for optimizing reinforcement learning systems.