## Bar Chart: Δ w.r.t. average human rater (%)
### Overview
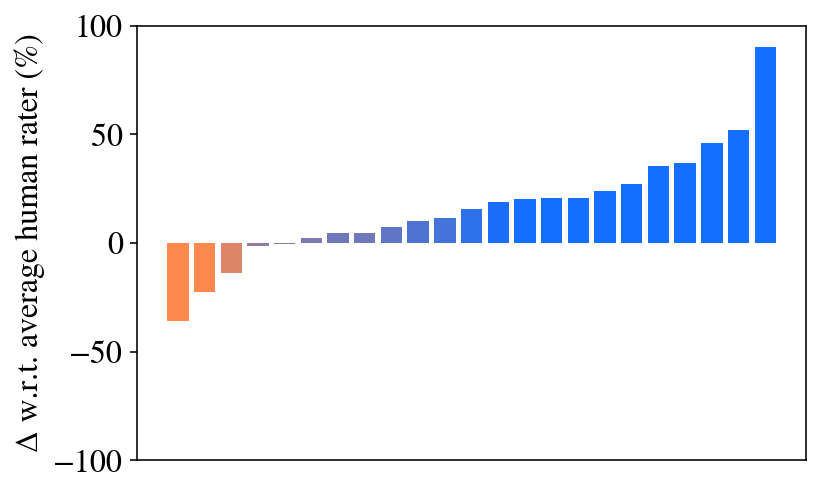
The chart visualizes the distribution of percentage changes (Δ) in average human rater scores across sentiment categories. The x-axis represents sentiment labels (from "Very negative" to "Very positive"), while the y-axis shows the magnitude of change in percentage. Bars are color-coded: red for negative changes, blue for positive changes, and gray for neutral/zero changes.
### Components/Axes
- **X-axis**: Sentiment categories labeled as:
- Very negative
- Negative
- Neutral
- Positive
- Very positive
- **Y-axis**: Δ w.r.t. average human rater (%) ranging from -100% to +100%.
- **Legend**: Located at the bottom-right corner, mapping colors to sentiment polarity:
- Red: Negative changes
- Blue: Positive changes
- Gray: Neutral/zero changes
### Detailed Analysis
1. **Negative Sentiment (Left Side)**:
- "Very negative" (red bar): Approximately -60%.
- "Negative" (red bar): Approximately -40%.
- "Neutral" (gray bar): Approximately -5%.
- "Positive" (blue bar): Approximately +10%.
- "Very positive" (blue bar): Approximately +90%.
2. **Positive Sentiment (Right Side)**:
- The largest bar corresponds to "Very positive," reaching ~90%.
- "Positive" shows ~40%, with smaller increments for "Neutral" (~+5%) and "Negative" (~+10%).
### Key Observations
- The most significant increase in rater scores occurs in the "Very positive" category (+90%).
- Negative sentiment categories show smaller magnitude changes compared to positive ones.
- The "Neutral" category has minimal change (~+5%), acting as a transitional point between negative and positive shifts.
### Interpretation
The data suggests a strong positive bias in human rater evaluations, with the highest impact observed in the "Very positive" category. The stark contrast between negative (-60%) and very positive (+90%) values indicates a polarized distribution, possibly reflecting a scenario where interventions or stimuli strongly influenced perceptions toward positivity. The near-zero change in "Neutral" (-5%) implies limited impact on neutral sentiments. This pattern could highlight the effectiveness of a targeted strategy or the presence of extreme outliers in the dataset.