# Technical Document Extraction: High-d Case Analysis
## Title
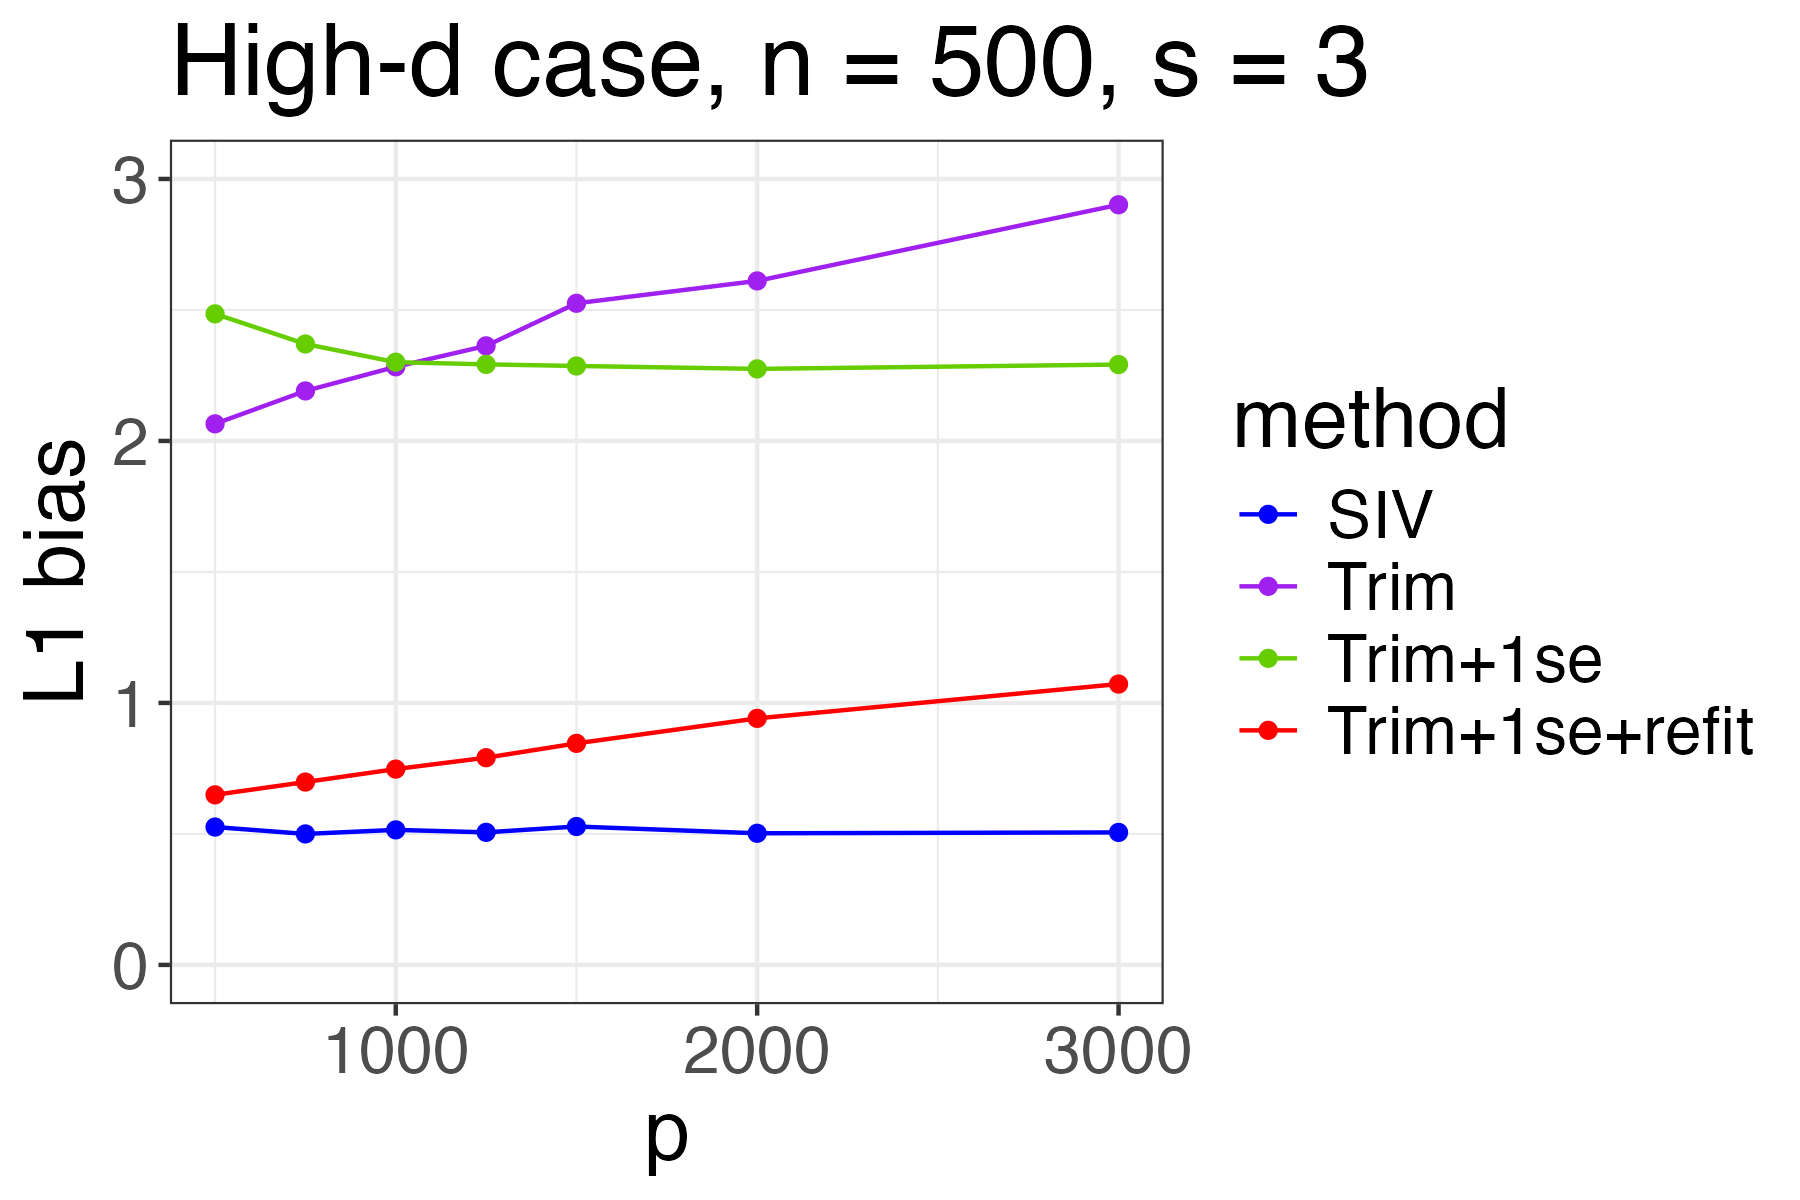
**High-d case, n = 500, s = 3**
## Axes Labels
- **X-axis**: `p` (ranging from 1000 to 3000)
- **Y-axis**: `L1 bias` (ranging from 0 to 3)
## Legend
- **Location**: Right side of the plot
- **Methods**:
- `SIV` (blue line with markers)
- `Trim` (purple line with markers)
- `Trim+1se` (green line with markers)
- `Trim+1se+refit` (red line with markers)
## Key Trends
1. **SIV (blue)**:
- **Trend**: Flat line with minimal variation.
- **Data Points**:
- `p = 1000`: ~0.5
- `p = 2000`: ~0.5
- `p = 3000`: ~0.5
2. **Trim (purple)**:
- **Trend**: Steadily increasing.
- **Data Points**:
- `p = 1000`: ~2.0
- `p = 2000`: ~2.6
- `p = 3000`: ~2.9
3. **Trim+1se (green)**:
- **Trend**: Slightly decreasing then stabilizing.
- **Data Points**:
- `p = 1000`: ~2.5
- `p = 2000`: ~2.3
- `p = 3000`: ~2.3
4. **Trim+1se+refit (red)**:
- **Trend**: Gradual increase.
- **Data Points**:
- `p = 1000`: ~0.7
- `p = 2000`: ~0.9
- `p = 3000`: ~1.1
## Spatial Grounding
- **Legend Position**: Right-aligned, outside the plot area.
- **Color Consistency**:
- Blue markers correspond to `SIV`.
- Purple markers correspond to `Trim`.
- Green markers correspond to `Trim+1se`.
- Red markers correspond to `Trim+1se+refit`.
## Additional Notes
- No non-English text detected.
- No embedded data tables or heatmaps present.
- All textual information is in English.
## Diagram Components
1. **Header**: Title (`High-d case, n = 500, s = 3`).
2. **Main Chart**: Line plot with four data series.
3. **Footer**: Legend with method labels and colors.
## Conclusion
The plot compares four methods (`SIV`, `Trim`, `Trim+1se`, `Trim+1se+refit`) across varying `p` values, showing distinct trends in `L1 bias`. The `Trim` method exhibits the highest bias, while `SIV` remains stable. No critical data omissions identified.