## Diagram: Math Knowledge Graph Generation
### Overview
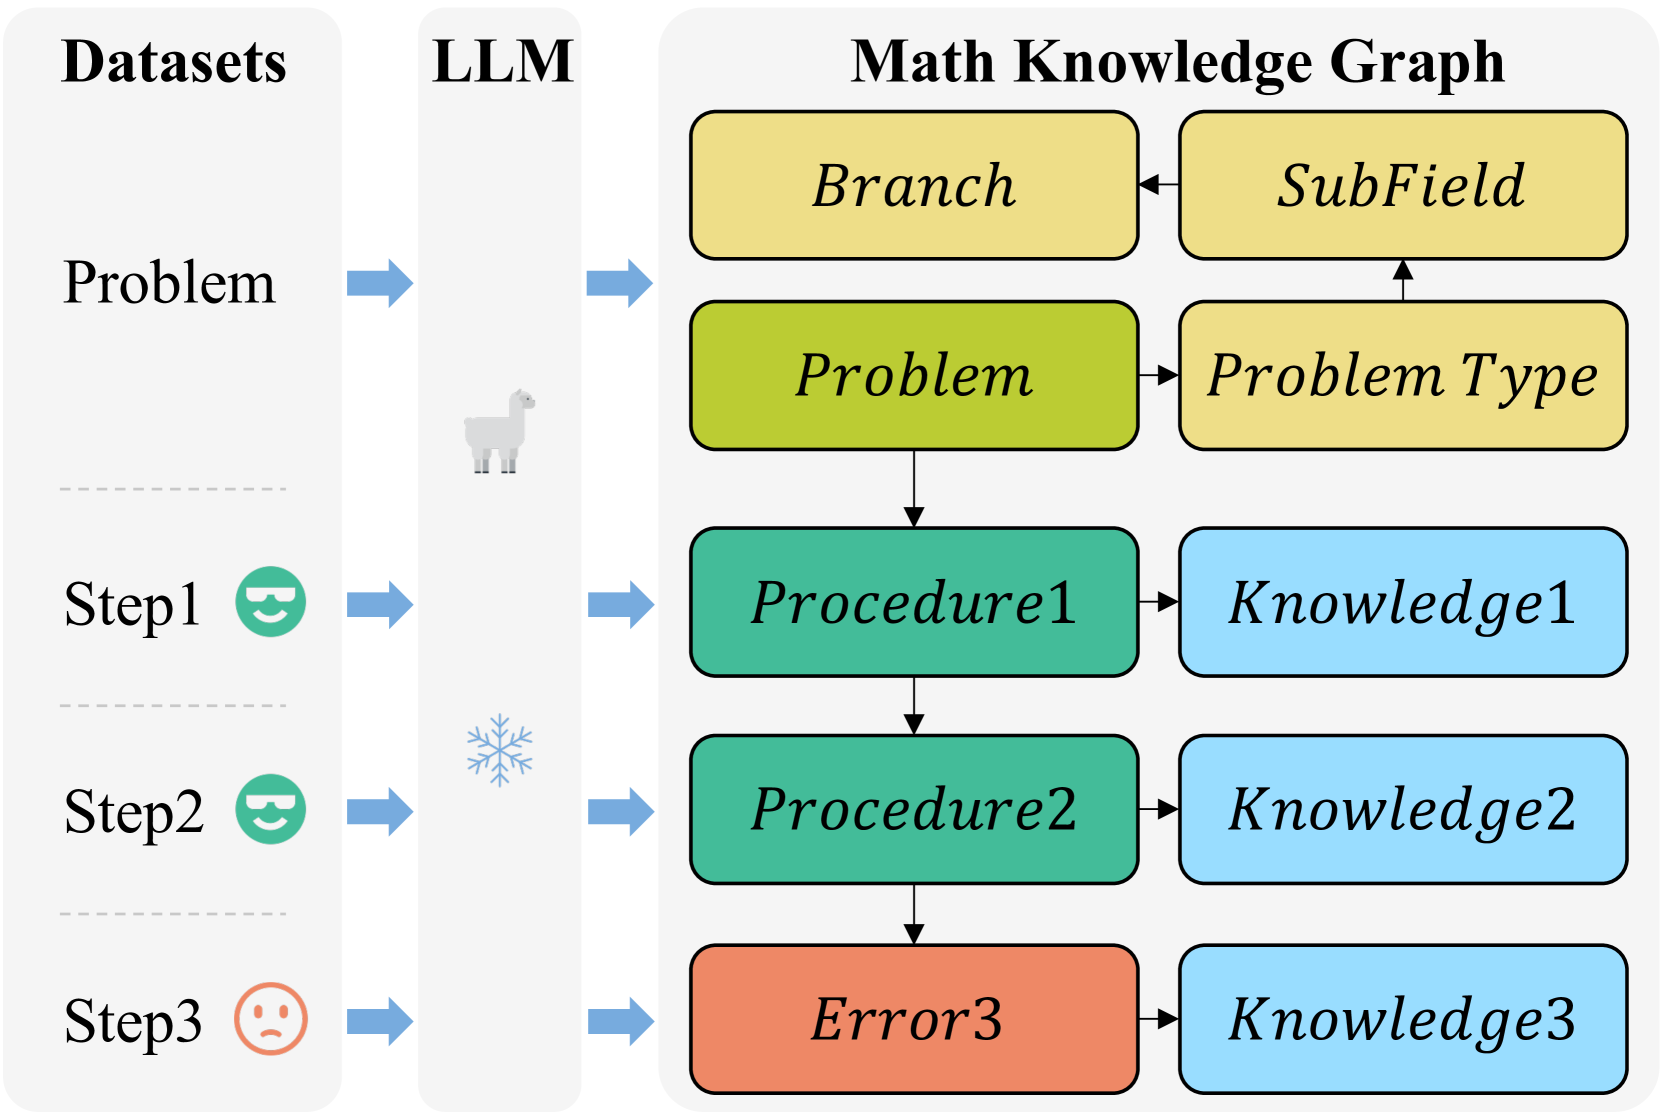
The image is a diagram illustrating the process of generating a Math Knowledge Graph using Datasets and a Large Language Model (LLM). It shows how a problem from a dataset is processed by the LLM to generate a knowledge graph, potentially involving multiple steps and leading to either correct procedures or errors.
### Components/Axes
* **Datasets:** This column represents the input data, including problems and steps.
* Problem
* Step1 (indicated by a smiling face emoji with sunglasses)
* Step2 (indicated by a smiling face emoji with sunglasses)
* Step3 (indicated by a frowning face emoji)
* **LLM:** This column represents the Large Language Model, which processes the input data.
* An image of a llama is present between "Problem" and "Step1".
* An image of a snowflake is present between "Step1" and "Step2".
* **Math Knowledge Graph:** This section represents the output of the LLM, a structured knowledge graph.
* Branch (yellow)
* SubField (yellow)
* Problem (green)
* Problem Type (yellow)
* Procedure1 (teal)
* Knowledge1 (light blue)
* Procedure2 (teal)
* Knowledge2 (light blue)
* Error3 (orange)
* Knowledge3 (light blue)
### Detailed Analysis
The diagram illustrates a flow from left to right, starting with the Datasets and progressing through the LLM to the Math Knowledge Graph.
* **Datasets to LLM:**
* "Problem" from Datasets is processed by the LLM (represented by a llama icon).
* "Step1" from Datasets (represented by a smiling face emoji with sunglasses) is processed by the LLM.
* "Step2" from Datasets (represented by a smiling face emoji with sunglasses) is processed by the LLM (represented by a snowflake icon).
* "Step3" from Datasets (represented by a frowning face emoji) is processed by the LLM.
* **LLM to Math Knowledge Graph:**
* The LLM processes the "Problem" to generate "Branch" and "Problem", which are connected to "SubField" and "Problem Type" respectively.
* The LLM processes "Step1" to generate "Procedure1", which is connected to "Knowledge1".
* The LLM processes "Step2" to generate "Procedure2", which is connected to "Knowledge2".
* The LLM processes "Step3" to generate "Error3", which is connected to "Knowledge3".
### Key Observations
* The diagram shows a sequential process where data from the Datasets column is fed into the LLM, which then generates components of the Math Knowledge Graph.
* The use of emojis (smiling faces with sunglasses and a frowning face) suggests different outcomes or states in the process.
* The different colors of the boxes in the Math Knowledge Graph likely represent different categories or types of knowledge.
### Interpretation
The diagram illustrates a system for generating a Math Knowledge Graph using an LLM. The process starts with input data (Problems and Steps) and uses the LLM to extract and structure knowledge. The different steps and outcomes (correct procedures vs. errors) suggest that the LLM's performance can vary. The knowledge graph components (Branch, SubField, Problem, Problem Type, Procedure, Knowledge, Error) represent the different types of information that the LLM can extract and organize. The diagram highlights the potential of LLMs to automate the creation of structured knowledge from unstructured data.