\n
## Grid Arrangement: Array and Choice Configurations
### Overview
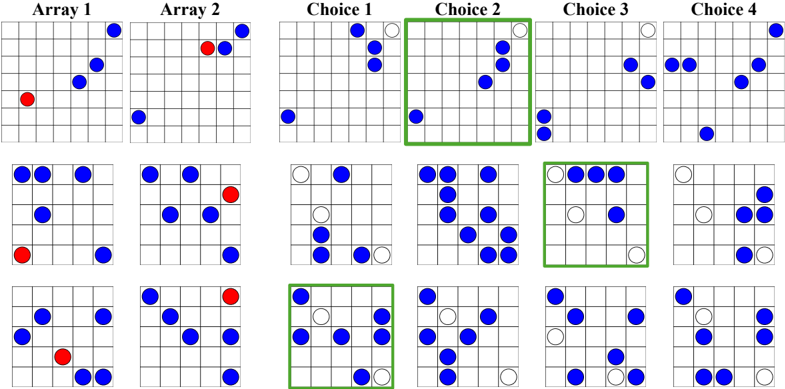
The image presents a 3x2 grid of arrays, each containing a set of blue and red dots on a square grid. To the right of the arrays are four "Choice" grids, also containing blue and white dots. The arrays appear to be source data, and the choices represent potential transformations or selections from those arrays.
### Components/Axes
The image is organized into two main sections: "Array" and "Choice".
- **Arrays:** Labeled "Array 1" and "Array 2", repeated three times vertically. Each array is a 7x7 grid.
- **Choices:** Labeled "Choice 1", "Choice 2", "Choice 3", and "Choice 4", repeated three times vertically. Each choice is a 7x7 grid.
- **Dots:** Blue and red dots are present in the Array grids. Blue and white dots are present in the Choice grids.
- **Grid:** All grids are composed of a 7x7 arrangement of cells.
### Detailed Analysis or Content Details
Let's analyze the dot configurations in each array and choice. I will describe the approximate position of each dot, referencing rows and columns starting from 1 at the top-left.
**Array Configurations (repeated 3 times):**
* **Array 1:**
* Red dot: (2, 2)
* Blue dots: (1, 4), (3, 6), (4, 1), (5, 5), (6, 3)
* **Array 2:**
* Red dot: (2, 6)
* Blue dots: (1, 3), (3, 2), (4, 7), (5, 4), (6, 1)
**Choice Configurations (repeated 3 times):**
* **Choice 1:**
* Blue dots: (2, 2), (3, 3), (4, 4), (5, 5), (6, 6)
* White dots: All other cells.
* **Choice 2:**
* Blue dots: (3, 1), (4, 2), (5, 3), (6, 4)
* White dots: All other cells.
* **Choice 3:**
* Blue dots: (1, 5), (2, 4), (3, 3), (4, 2), (5, 1)
* White dots: All other cells.
* **Choice 4:**
* Blue dots: (1, 1), (3, 4), (5, 6), (7, 7)
* White dots: All other cells.
The green rectangles highlight Choice 2 and Choice 3 in each row.
### Key Observations
* Each array has one red dot and five blue dots.
* Each choice grid contains a varying number of blue dots, with the rest of the cells being white.
* The choices appear to be selections or transformations of the dots from the arrays.
* The green rectangles consistently highlight Choice 2 and Choice 3, suggesting these are of particular interest.
* The dot positions within the arrays and choices do not appear to follow a simple, predictable pattern.
### Interpretation
The image likely represents a visual experiment or a problem-solving task. The arrays could be initial states, and the choices represent possible actions or outcomes. The highlighting of Choice 2 and Choice 3 suggests that these choices are being evaluated or compared.
The arrangement of dots within the arrays and choices could be encoding information, such as coordinates or features. The task might involve identifying patterns, predicting outcomes, or selecting the best choice based on certain criteria. Without further context, it's difficult to determine the exact purpose of this arrangement. The image could be related to a cognitive psychology experiment, a data visualization technique, or a game-like puzzle. The consistent highlighting of specific choices suggests a focus on those particular options within the broader set of possibilities.