\n
## Visual Pattern Recognition Test: Grid-Based Arrays and Choices
### Overview
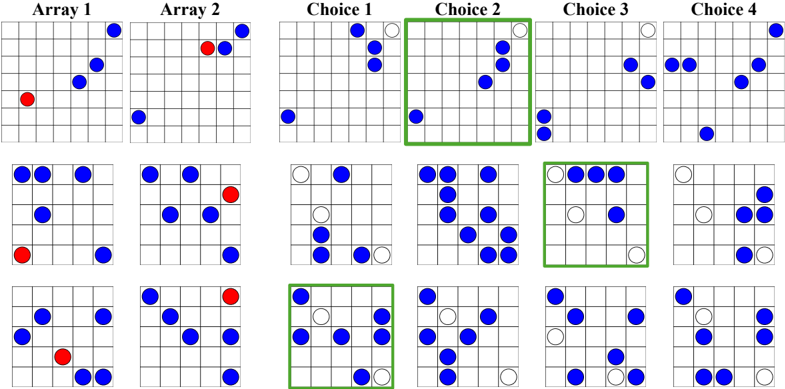
The image displays a visual reasoning test consisting of three rows of 5x5 grids. Each row presents a problem with two "Array" grids on the left and four "Choice" grids on the right. The grids contain colored dots (blue, red, and white/empty circles). One choice in each row is highlighted with a green border, indicating it is the selected or correct answer. The test appears to assess pattern recognition, spatial reasoning, or rule induction.
### Components/Axes
- **Structure**: Three horizontal rows. Each row contains six grids arranged from left to right.
- **Grid Labels (Top Row Only)**: The first row has explicit text labels above the grids: "Array 1", "Array 2", "Choice 1", "Choice 2", "Choice 3", "Choice 4". The middle and bottom rows lack explicit labels but follow the same logical structure.
- **Grid Content**: Each grid is a 5x5 matrix (5 rows, 5 columns). Cells contain:
- **Blue dots**: Solid blue circles.
- **Red dots**: Solid red circles (appear only in "Array" grids).
- **White circles**: Outlined circles with white fill (appear only in "Choice" grids).
- **Highlighting**: A green rectangular border surrounds one "Choice" grid in each row.
### Detailed Analysis
#### Row 1 (Top)
- **Array 1**: Contains 4 blue dots and 1 red dot. Red dot position: Row 4, Column 1 (counting from top-left as R1,C1). Blue dots at: R1,C5; R2,C4; R3,C3; R5,C2.
- **Array 2**: Contains 4 blue dots and 1 red dot. Red dot position: R2,C3. Blue dots at: R1,C5; R2,C4; R3,C3; R5,C2. *Note: The blue dot positions are identical to Array 1.*
- **Choice 1**: Contains 4 blue dots and 2 white circles. No green border.
- **Choice 2 (Green Border)**: Contains 4 blue dots and 2 white circles. Blue dots at: R2,C4; R3,C3; R4,C2; R5,C1. White circles at: R1,C5; R5,C5.
- **Choice 3**: Contains 4 blue dots and 2 white circles.
- **Choice 4**: Contains 4 blue dots and 2 white circles.
#### Row 2 (Middle)
- **Left Group (Arrays)**: Three grids, each with blue dots and one red dot. The red dot moves position across the three grids.
- **Right Group (Choices)**: Three grids with blue dots and white circles. The third choice grid has a green border.
- **Green-Bordered Choice**: Contains 5 blue dots and 3 white circles. Blue dots form a cluster in the top-left quadrant.
#### Row 3 (Bottom)
- **Left Group (Arrays)**: Three grids with blue dots and one red dot.
- **Right Group (Choices)**: Three grids with blue dots and white circles. The first choice grid has a green border.
- **Green-Bordered Choice**: Contains 5 blue dots and 3 white circles. Blue dots are arranged in a diagonal pattern from top-left to bottom-right.
### Key Observations
1. **Consistent Structure**: Each problem row follows the pattern: two or three "Array" grids (with red dots) followed by three or four "Choice" grids (with white circles).
2. **Dot Count Consistency**: In Row 1, all Array and Choice grids contain exactly 4 blue dots. The red dot in Arrays and white circles in Choices appear to be additional elements.
3. **Pattern Inference**: The task likely requires the test-taker to deduce a rule from the Array grids (e.g., the relationship between the red dot and blue dots, or a transformation rule) and apply it to select the correct Choice grid.
4. **Green Border Significance**: The green border consistently highlights one Choice grid per row, strongly suggesting it is the correct answer based on the inferred rule.
5. **Spatial Arrangement**: The red dot in Arrays and the white circles in Choices may serve as markers or pivots for the pattern. For example, in Row 1, the blue dot pattern is identical in both Arrays, but the red dot moves. The correct Choice (Choice 2) has a blue dot pattern that is a mirror or rotation of the Array pattern.
### Interpretation
This image is a screenshot or reproduction of a non-verbal reasoning test, commonly found in IQ assessments, cognitive ability tests, or psychological research. The test evaluates fluid intelligence—the ability to solve novel problems, identify patterns, and deduce rules without relying on prior knowledge.
- **What the Data Suggests**: The test presents a rule-induction problem. The examinee must observe the configuration of dots in the "Array" grids, determine the underlying rule governing their arrangement (e.g., movement, reflection, rotation, or a rule linking the red dot to the blue dot pattern), and then identify which "Choice" grid follows the same rule.
- **Relationship Between Elements**: The "Array" grids provide the example or premise. The "Choice" grids are the possible answers. The red dot likely acts as a key variable or indicator of the rule's application. The white circles in the Choices may correspond to the red dot's position or function in the rule.
- **Notable Anomalies/Patterns**: The most striking pattern is the identical blue dot layout in Row 1's Array 1 and Array 2, with only the red dot changing position. This suggests the rule may be independent of the blue dot arrangement itself and instead depends on the relationship between the red dot and a fixed blue dot pattern. The correct Choice (Choice 2) does not have a red dot but has white circles, implying the rule translates the red dot's function into a new element (white circle) in the answer.
- **Peircean Investigation**: From a semiotic perspective, the grids are icons representing an abstract rule. The red dot is an indexical sign pointing to a specific transformation. The test-taker must decode the symbolic rule connecting the index (red dot) to the iconic representation (blue dot pattern) to select the correct icon (Choice grid). The green border is a meta-sign, indicating the solution for validation purposes.
**In summary, this is a visual logic puzzle designed to test abstract reasoning. The core task is to extract a spatial rule from example grids and apply it to select the correct matching grid from a set of options.**