## Grid-Based Selection Diagram: Array Transformation Process
### Overview
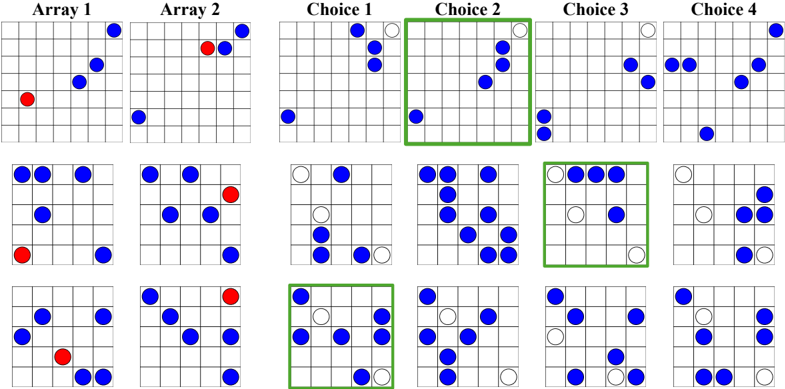
The image displays a 3x4 grid of 12 smaller 5x5 matrices arranged in three rows. Each matrix contains colored dots (blue, red, white) with specific positional patterns. The diagram is divided into three main sections:
1. **Array 1** (top-left 3x2 grids)
2. **Array 2** (middle 3x2 grids)
3. **Choice 1-4** (rightmost 3x4 grids)
Notable elements include:
- Red dots in Array 1/2 grids
- White dots in Choice grids
- Green outline highlighting Choice 2 in the top row
### Components/Axes
**Primary Labels:**
- Top row: "Array 1" (left), "Array 2" (center), "Choice 1-4" (right)
- Each grid: 5x5 coordinate system with no explicit axis labels
- Color coding:
- Red: Array 1/2 elements
- Blue: Base elements
- White: Selected/transformed elements
- Green: Highlight indicator
**Spatial Relationships:**
- Array 1: Top-left quadrant (3 grids)
- Array 2: Middle-left quadrant (3 grids)
- Choices: Right quadrant (4 grids)
- Green outline: Top row, second column (Choice 2)
### Detailed Analysis
**Array 1 Patterns:**
1. First grid: Red dot at (1,1), blue dots at (2,2), (3,3), (4,4)
2. Second grid: Red dot at (1,3), blue dots at (2,1), (3,2), (4,4)
3. Third grid: Red dot at (3,1), blue dots at (1,2), (2,3), (4,4)
**Array 2 Patterns:**
1. First grid: Red dot at (2,2), blue dots at (1,1), (3,3), (4,4)
2. Second grid: Red dot at (3,3), blue dots at (1,1), (2,2), (4,4)
3. Third grid: Red dot at (4,4), blue dots at (1,1), (2,2), (3,3)
**Choice Grids:**
- All choices show blue base elements with white overlays
- White dot patterns vary:
- Choice 1: 3 white dots in diagonal formation
- Choice 2: 4 white dots forming square pattern (highlighted)
- Choice 3: 2 white dots in opposite corners
- Choice 4: 3 white dots in triangular formation
### Key Observations
1. **Red Dot Distribution:**
- Array 1: Red dots positioned at matrix diagonals
- Array 2: Red dots positioned at matrix anti-diagonals
- No red dots in Choice grids
2. **White Dot Patterns:**
- Choice 2 (highlighted) shows most complex pattern (4 dots)
- All choices maintain blue base elements while adding white overlays
3. **Spatial Logic:**
- Array 1/2 red dots appear to "transform" into white dots in choices
- Green outline suggests Choice 2 represents optimal transformation
### Interpretation
This diagram appears to model a selection/transformation process:
1. **Input Arrays:** Array 1 and 2 represent different input configurations with red dots as key elements
2. **Transformation Logic:** Blue elements remain constant while red elements are converted to white through selection
3. **Optimal Outcome:** The green-highlighted Choice 2 suggests a preferred transformation pattern (4 white dots forming square)
4. **Pattern Significance:** Diagonal/anti-diagonal red dot placement in arrays correlates with specific white dot configurations in choices
The diagram demonstrates a systematic approach to element selection/transformation, with the green outline serving as a visual cue for the optimal solution. The consistent blue base elements across all choices indicate preserved elements during the transformation process.