## Line Chart: Mutual Information Surprise
### Overview
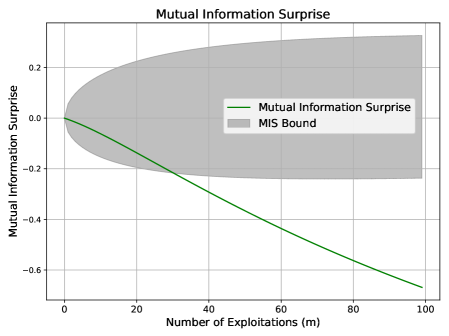
The image is a line chart titled "Mutual Information Surprise," depicting the relationship between the number of exploitations (m) and mutual information surprise. The chart includes a green line representing the "Mutual Information Surprise" and a gray shaded area labeled "MIS Bound." The x-axis ranges from 0 to 100 (number of exploitations), and the y-axis ranges from -0.6 to 0.2 (mutual information surprise).
### Components/Axes
- **Title**: "Mutual Information Surprise"
- **X-axis**: "Number of Exploitations (m)" with values from 0 to 100.
- **Y-axis**: "Mutual Information Surprise" with values from -0.6 to 0.2.
- **Legend**: Located in the upper-right corner, with two entries:
- **Green line**: "Mutual Information Surprise"
- **Gray shaded area**: "MIS Bound"
### Detailed Analysis
- **Green Line (Mutual Information Surprise)**:
- Starts at (0, 0) and decreases linearly to approximately (-0.6, 100).
- Slope: Approximately -0.006 per unit of m (calculated as (-0.6 - 0)/(100 - 0)).
- Equation: $ y = -0.006m $.
- **Gray Shaded Area (MIS Bound)**:
- Starts at (0, 0) and extends horizontally to the right, covering the upper portion of the chart.
- Upper boundary: Approximately 0.2 (y-axis limit).
- Shape: A trapezoidal region starting at (0, 0) and extending to the right, with the upper edge at y=0.2.
### Key Observations
1. The mutual information surprise decreases linearly as the number of exploitations increases.
2. The MIS Bound is a shaded region that starts at 0 and extends to the right, suggesting a theoretical or empirical upper limit for mutual information surprise.
3. The green line (actual mutual information surprise) remains below the MIS Bound throughout the range of exploitations.
### Interpretation
The chart illustrates that mutual information surprise diminishes with increasing exploitations, following a linear trend. The MIS Bound likely represents a theoretical or empirical upper limit, as the green line (actual surprise) never exceeds this bound. The shaded area may indicate a confidence interval or a range of expected values, but the exact relationship between the bound and the actual surprise requires further context. The linear decrease suggests that exploitations systematically reduce mutual information surprise, possibly due to diminishing returns or saturation effects in the system being studied.