## Chart: Mutual Information Surprise
### Overview
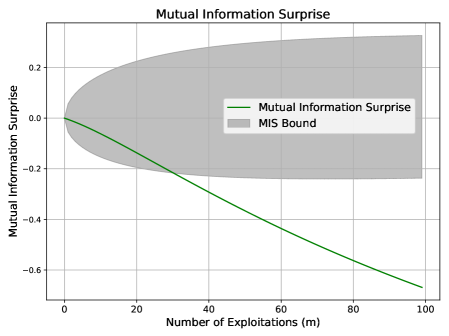
The image is a line chart showing the "Mutual Information Surprise" as a function of the "Number of Exploitations (m)". It also displays a shaded region representing the "MIS Bound". The x-axis represents the number of exploitations, ranging from 0 to 100. The y-axis represents the mutual information surprise, ranging from approximately -0.7 to 0.3.
### Components/Axes
* **Title:** Mutual Information Surprise
* **X-axis:** Number of Exploitations (m), ranging from 0 to 100 in increments of 20.
* **Y-axis:** Mutual Information Surprise, ranging from -0.6 to 0.2 in increments of 0.2.
* **Legend:** Located in the top-right quadrant of the chart.
* Green line: Mutual Information Surprise
* Grey shaded area: MIS Bound
### Detailed Analysis
* **Mutual Information Surprise (Green Line):** The green line starts at approximately 0 when the number of exploitations is 0. It then decreases steadily as the number of exploitations increases. At 100 exploitations, the Mutual Information Surprise is approximately -0.67.
* **MIS Bound (Grey Shaded Area):** The grey shaded area represents the MIS Bound. It starts at approximately +/- 0.15 when the number of exploitations is 0. The bound widens as the number of exploitations increases, reaching a maximum width at approximately 40 exploitations. After that, the bound remains relatively constant. The upper bound reaches approximately 0.25, and the lower bound reaches approximately -0.25.
### Key Observations
* The Mutual Information Surprise decreases as the number of exploitations increases.
* The MIS Bound widens initially and then stabilizes.
* The Mutual Information Surprise line stays within the MIS Bound.
### Interpretation
The chart illustrates how the mutual information surprise changes with an increasing number of exploitations. The decreasing trend of the green line suggests that as the agent explores more, the surprise associated with new information decreases. The MIS Bound provides a range within which the mutual information surprise is expected to fall. The fact that the green line remains within the grey area suggests that the observed surprise is within the expected bounds. The widening of the MIS Bound initially could indicate that the uncertainty or variability in the surprise is higher during the initial stages of exploration.