## Line Chart: Sensitivity to Temperature
### Overview
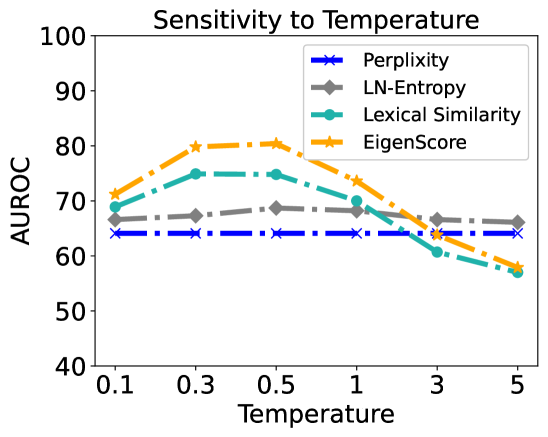
The image is a line chart showing the sensitivity of four different metrics (Perplexity, LN-Entropy, Lexical Similarity, and EigenScore) to temperature. The x-axis represents temperature, and the y-axis represents AUROC (Area Under the Receiver Operating Characteristic curve).
### Components/Axes
* **Title:** Sensitivity to Temperature
* **X-axis:** Temperature, with tick marks at 0.1, 0.3, 0.5, 1, 3, and 5.
* **Y-axis:** AUROC, with tick marks at 40, 50, 60, 70, 80, 90, and 100.
* **Legend:** Located at the top-right of the chart.
* **Blue (dash-dot line with x markers):** Perplexity
* **Gray (solid line with diamond markers):** LN-Entropy
* **Teal (solid line with circle markers):** Lexical Similarity
* **Orange (dash-dot line with star markers):** EigenScore
### Detailed Analysis
* **Perplexity (Blue):** The line is relatively flat, hovering around an AUROC of 64, with minor fluctuations.
* At Temperature 0.1, AUROC is approximately 64.
* At Temperature 0.3, AUROC is approximately 64.
* At Temperature 0.5, AUROC is approximately 64.
* At Temperature 1, AUROC is approximately 64.
* At Temperature 3, AUROC is approximately 64.
* At Temperature 5, AUROC is approximately 64.
* **LN-Entropy (Gray):** The line starts around 67 AUROC, increases slightly to around 69 at 0.5, and then decreases to around 65 at temperature 3 and 5.
* At Temperature 0.1, AUROC is approximately 67.
* At Temperature 0.3, AUROC is approximately 68.
* At Temperature 0.5, AUROC is approximately 69.
* At Temperature 1, AUROC is approximately 68.
* At Temperature 3, AUROC is approximately 66.
* At Temperature 5, AUROC is approximately 64.
* **Lexical Similarity (Teal):** The line starts around 69 AUROC, increases to around 75 at 0.3, remains relatively stable until temperature 1, and then decreases to around 57 at temperature 5.
* At Temperature 0.1, AUROC is approximately 69.
* At Temperature 0.3, AUROC is approximately 75.
* At Temperature 0.5, AUROC is approximately 75.
* At Temperature 1, AUROC is approximately 70.
* At Temperature 3, AUROC is approximately 61.
* At Temperature 5, AUROC is approximately 57.
* **EigenScore (Orange):** The line starts around 72 AUROC, increases to around 80 at 0.3 and 0.5, and then decreases to around 62 at temperature 5.
* At Temperature 0.1, AUROC is approximately 72.
* At Temperature 0.3, AUROC is approximately 80.
* At Temperature 0.5, AUROC is approximately 80.
* At Temperature 1, AUROC is approximately 74.
* At Temperature 3, AUROC is approximately 66.
* At Temperature 5, AUROC is approximately 58.
### Key Observations
* Perplexity is the least sensitive to temperature changes, maintaining a consistently low AUROC.
* EigenScore and Lexical Similarity show a similar trend: an initial increase in AUROC followed by a decrease as temperature increases.
* LN-Entropy shows a slight increase and then a decrease.
* All metrics except Perplexity show a decrease in AUROC at higher temperatures.
### Interpretation
The chart suggests that the performance of different metrics, as measured by AUROC, is affected by temperature. Perplexity appears to be the most stable metric across different temperatures, while EigenScore and Lexical Similarity are more sensitive, showing a peak in performance at lower temperatures (0.3-0.5) and a decline at higher temperatures. This could indicate that these metrics are more effective within a specific temperature range, while Perplexity's consistent performance might make it a more reliable choice across varying conditions. The decrease in AUROC for most metrics at higher temperatures could imply that the models or systems using these metrics become less accurate or reliable as temperature increases.