## Line Chart: Sensitivity to Temperature
### Overview
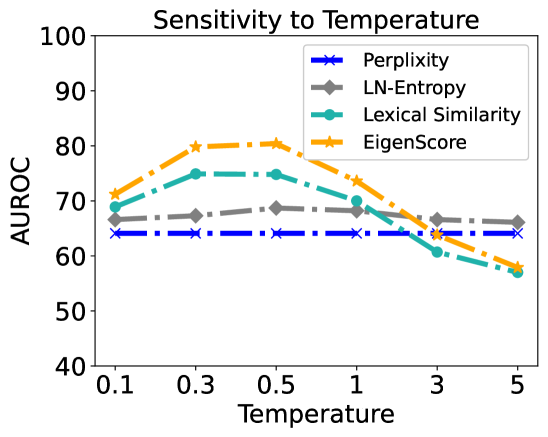
This image is a line chart titled "Sensitivity to Temperature." It evaluates the performance of four different metrics—Perplexity, LN-Entropy, Lexical Similarity, and EigenScore—across varying "Temperature" settings. Performance is measured using the AUROC (Area Under the Receiver Operating Characteristic curve) metric. The chart demonstrates how the reliability of these metrics changes as the sampling temperature of a model (likely a Large Language Model) is adjusted.
### Components/Axes
* **Title**: "Sensitivity to Temperature" (centered at the top).
* **Y-Axis**:
* **Label**: "AUROC" (positioned vertically on the left).
* **Scale**: Ranges from 40 to 100.
* **Markers**: Major ticks at intervals of 10 (40, 50, 60, 70, 80, 90, 100).
* **X-Axis**:
* **Label**: "Temperature" (centered at the bottom).
* **Scale**: Categorical/Logarithmic-style spacing with specific values: 0.1, 0.3, 0.5, 1, 3, 5.
* **Legend**: Located in the **top-right** corner of the plot area.
* **Perplexity**: Blue solid line with 'x' markers and a dash-dot pattern.
* **LN-Entropy**: Grey solid line with diamond markers and a dashed pattern.
* **Lexical Similarity**: Teal/Cyan solid line with circle markers and a dash-dot pattern.
* **EigenScore**: Orange solid line with five-pointed star markers and a dash-dot pattern.
### Detailed Analysis
The following table reconstructs the approximate AUROC values based on the visual placement of data points:
| Temperature | Perplexity (Blue 'x') | LN-Entropy (Grey Diamond) | Lexical Similarity (Teal Circle) | EigenScore (Orange Star) |
| :--- | :--- | :--- | :--- | :--- |
| **0.1** | ~64 | ~66.5 | ~69 | ~71 |
| **0.3** | ~64 | ~67.5 | ~75 | ~80 |
| **0.5** | ~64 | ~68.5 | ~75 | ~80.5 |
| **1** | ~64 | ~68 | ~70 | ~73.5 |
| **3** | ~64 | ~66.5 | ~61 | ~64 |
| **5** | ~64 | ~66 | ~57 | ~58 |
#### Trend Verification:
* **Perplexity**: The line is perfectly horizontal (flat). It shows zero sensitivity to the temperature parameter.
* **LN-Entropy**: The line is relatively stable with a very slight upward curve, peaking at Temperature 0.5 before a marginal decline.
* **Lexical Similarity**: The line slopes upward from 0.1 to 0.3, plateaus between 0.3 and 0.5, and then slopes downward sharply as temperature increases beyond 0.5.
* **EigenScore**: This line shows the most significant variation. It slopes upward steeply to a peak at 0.5 and then slopes downward sharply, crossing below the Perplexity and LN-Entropy lines at high temperatures.
### Key Observations
* **Peak Performance**: Both EigenScore and Lexical Similarity reach their peak performance at a temperature range of 0.3 to 0.5.
* **Highest Performer**: EigenScore achieves the highest overall AUROC (approximately 80.5 at T=0.5).
* **Robustness**: LN-Entropy is the most robust metric among those that vary, maintaining a tight range between ~66 and ~68.5 AUROC.
* **Baseline**: Perplexity acts as a constant baseline at ~64 AUROC.
* **Degradation**: At high temperatures (T=5), the performance of Lexical Similarity (~57) and EigenScore (~58) drops below the Perplexity baseline (~64).
### Interpretation
The data suggests that the choice of sampling temperature is critical for metrics that rely on consistency or structural analysis of model outputs (like EigenScore and Lexical Similarity).
1. **The "Sweet Spot"**: The peak at T=0.3–0.5 suggests that these metrics require a balance of diversity in generated samples. At very low temperatures (0.1), samples may be too repetitive to provide meaningful variance. At high temperatures (3.0–5.0), the samples likely become too chaotic or "hallucinated," introducing noise that degrades the metric's ability to distinguish correct from incorrect information.
2. **Metric Characteristics**:
* **EigenScore** is highly effective but very sensitive to noise.
* **LN-Entropy** appears to measure a property of the model's distribution that is largely independent of the specific sampling temperature used for generation.
* **Perplexity**'s flat line indicates it is likely calculated on a fixed set of data or is a property of the model's base probability distribution, making it a "temperature-independent" baseline in this specific experimental setup.
3. **Practical Application**: If using EigenScore for hallucination detection or uncertainty estimation, a temperature of 0.5 is optimal. Using a default temperature of 1.0 or higher would result in significantly lower reliability for that specific metric.