## Line Chart: Sensitivity to Temperature
### Overview
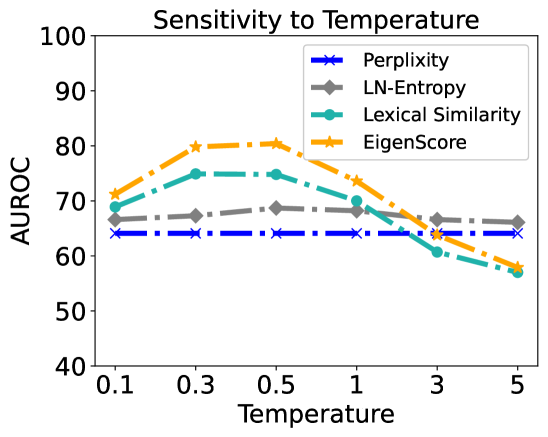
This line chart illustrates the relationship between Temperature and AUROC (Area Under the Receiver Operating Characteristic curve) for four different metrics: Perplexity, LN-Entropy, Lexical Similarity, and EigenScore. The chart aims to demonstrate how sensitive each metric is to changes in temperature.
### Components/Axes
* **Title:** Sensitivity to Temperature
* **X-axis:** Temperature, ranging from 0.1 to 5.0, with markers at 0.1, 0.3, 0.5, 1, 3, and 5.
* **Y-axis:** AUROC, ranging from 40 to 100, with markers at 40, 50, 60, 70, 80, 90, and 100.
* **Legend:** Located in the top-right corner, identifying the four data series:
* Perplexity (Blue, with triangle markers)
* LN-Entropy (Gray, with circle markers)
* Lexical Similarity (Teal, with diamond markers)
* EigenScore (Orange, with square markers)
### Detailed Analysis
Here's a breakdown of each data series, with approximate values extracted from the chart:
* **Perplexity (Blue Triangles):** The line is relatively flat, indicating minimal sensitivity to temperature.
* Temperature 0.1: AUROC ≈ 64
* Temperature 0.3: AUROC ≈ 64
* Temperature 0.5: AUROC ≈ 64
* Temperature 1: AUROC ≈ 64
* Temperature 3: AUROC ≈ 64
* Temperature 5: AUROC ≈ 64
* **LN-Entropy (Gray Circles):** The line shows a decreasing trend with increasing temperature.
* Temperature 0.1: AUROC ≈ 71
* Temperature 0.3: AUROC ≈ 71
* Temperature 0.5: AUROC ≈ 70
* Temperature 1: AUROC ≈ 68
* Temperature 3: AUROC ≈ 65
* Temperature 5: AUROC ≈ 63
* **Lexical Similarity (Teal Diamonds):** The line initially increases, reaches a peak, and then decreases with increasing temperature.
* Temperature 0.1: AUROC ≈ 68
* Temperature 0.3: AUROC ≈ 73
* Temperature 0.5: AUROC ≈ 76
* Temperature 1: AUROC ≈ 74
* Temperature 3: AUROC ≈ 67
* Temperature 5: AUROC ≈ 62
* **EigenScore (Orange Squares):** The line shows an increasing trend up to a peak, then a slight decrease.
* Temperature 0.1: AUROC ≈ 70
* Temperature 0.3: AUROC ≈ 75
* Temperature 0.5: AUROC ≈ 79
* Temperature 1: AUROC ≈ 78
* Temperature 3: AUROC ≈ 74
* Temperature 5: AUROC ≈ 68
### Key Observations
* Perplexity exhibits the least sensitivity to temperature, remaining consistently around an AUROC of 64.
* LN-Entropy shows a clear negative correlation with temperature – as temperature increases, AUROC decreases.
* Lexical Similarity demonstrates a more complex relationship, peaking around a temperature of 0.5 and then declining.
* EigenScore shows a positive correlation up to a temperature of 1, then a slight decline.
* The most significant changes in AUROC occur between temperatures of 0.1 and 1.
### Interpretation
The chart suggests that the choice of temperature significantly impacts the performance of some metrics (LN-Entropy, Lexical Similarity, and EigenScore) but not others (Perplexity). LN-Entropy appears to be negatively affected by higher temperatures, while Lexical Similarity and EigenScore benefit from moderate temperatures before experiencing a decline. This implies that these metrics capture different aspects of the underlying data and respond differently to variations in temperature.
The temperature parameter likely controls the randomness or exploration in a generative model. Lower temperatures lead to more deterministic outputs, while higher temperatures introduce more randomness. The differing sensitivities of these metrics suggest that some are more robust to noise or uncertainty (Perplexity), while others are more sensitive to the specific details of the generated output (LN-Entropy, Lexical Similarity, EigenScore).
The peak in Lexical Similarity and EigenScore could indicate an optimal temperature range where the generated outputs are both coherent and diverse. Beyond this point, increased randomness may lead to outputs that are less meaningful or relevant. The relatively flat line for Perplexity suggests it is a more stable measure, less affected by the level of randomness introduced by the temperature parameter.