## Line Chart: Sensitivity to Temperature
### Overview
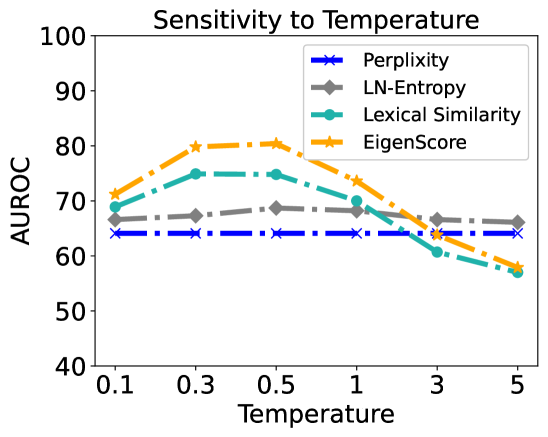
The image is a line chart titled "Sensitivity to Temperature." It plots the performance of four different metrics (Perplexity, LN-Entropy, Lexical Similarity, EigenScore) as a function of a "Temperature" parameter. The performance is measured by the AUROC (Area Under the Receiver Operating Characteristic Curve) score on the y-axis. The chart demonstrates how the AUROC for each metric changes as the temperature value increases from 0.1 to 5.
### Components/Axes
* **Chart Title:** "Sensitivity to Temperature" (Top Center)
* **Y-Axis:**
* **Label:** "AUROC" (Left side, rotated vertically)
* **Scale:** Linear, ranging from 40 to 100.
* **Major Ticks:** 40, 50, 60, 70, 80, 90, 100.
* **X-Axis:**
* **Label:** "Temperature" (Bottom Center)
* **Scale:** Appears to be logarithmic or categorical, with discrete points.
* **Tick Labels:** 0.1, 0.3, 0.5, 1, 3, 5.
* **Legend:** Located in the top-right corner of the plot area. It maps line colors and marker styles to metric names.
* **Blue line with 'x' markers:** Perplexity
* **Gray line with diamond markers:** LN-Entropy
* **Teal line with circle markers:** Lexical Similarity
* **Orange line with star markers:** EigenScore
### Detailed Analysis
The following table reconstructs the approximate AUROC values for each metric at the specified temperature points. Values are estimated from the chart's grid lines.
| Temperature | Perplexity (Blue, 'x') | LN-Entropy (Gray, Diamond) | Lexical Similarity (Teal, Circle) | EigenScore (Orange, Star) |
| :---------- | :---------------------- | :------------------------- | :-------------------------------- | :------------------------ |
| **0.1** | ~64 | ~66 | ~68 | ~71 |
| **0.3** | ~64 | ~67 | ~75 | ~80 |
| **0.5** | ~64 | ~68 | ~75 | ~80 |
| **1** | ~64 | ~68 | ~70 | ~74 |
| **3** | ~64 | ~67 | ~60 | ~64 |
| **5** | ~64 | ~66 | ~57 | ~58 |
**Trend Verification per Data Series:**
1. **Perplexity (Blue):** The line is perfectly horizontal. **Trend:** Constant. It shows no sensitivity to temperature, maintaining an AUROC of approximately 64 across all values.
2. **LN-Entropy (Gray):** The line has a very gentle arc. **Trend:** Slightly increases from ~66 to a peak of ~68 at Temperature=0.5/1, then gently decreases back to ~66. It shows low sensitivity.
3. **Lexical Similarity (Teal):** The line has a pronounced peak. **Trend:** Increases from ~68 to a peak of ~75 at Temperature=0.3/0.5, then decreases sharply, falling below its starting point to ~57 at Temperature=5. It shows high sensitivity, with performance degrading significantly at higher temperatures.
4. **EigenScore (Orange):** The line has the most pronounced peak. **Trend:** Increases from ~71 to a peak of ~80 at Temperature=0.3/0.5, then decreases steadily, falling to ~58 at Temperature=5. It shows the highest sensitivity and the best peak performance.
### Key Observations
* **Peak Performance:** Both **EigenScore** and **Lexical Similarity** achieve their highest AUROC (~80 and ~75, respectively) at the lower temperature range of 0.3 to 0.5.
* **Performance Degradation:** All metrics except Perplexity show a decline in AUROC as temperature increases beyond 1. The decline is most severe for **Lexical Similarity** and **EigenScore**.
* **Stability:** **Perplexity** is completely stable (flat line). **LN-Entropy** is relatively stable, with only minor fluctuations.
* **Crossover Points:** At Temperature=3, the performance of EigenScore, Lexical Similarity, and LN-Entropy converges around an AUROC of 64-67. At Temperature=5, EigenScore and Lexical Similarity perform worse than LN-Entropy and Perplexity.
* **Relative Ranking:** The ranking of metrics by AUROC changes with temperature. At T=0.5, the order is EigenScore > Lexical Similarity > LN-Entropy > Perplexity. At T=5, the order is LN-Entropy > Perplexity > EigenScore ≈ Lexical Similarity.
### Interpretation
This chart investigates how the effectiveness of different evaluation metrics (Perplexity, LN-Entropy, Lexical Similarity, EigenScore) for a certain task (likely related to language model output quality or detection) is influenced by the "Temperature" parameter, which typically controls randomness in generation.
The data suggests a clear trade-off:
* **EigenScore** is the most powerful metric at optimal (low) temperatures, achieving the highest AUROC. However, it is also the most fragile, with its performance collapsing as temperature increases.
* **Lexical Similarity** follows a similar but less extreme pattern, also peaking at low temperatures and degrading with higher randomness.
* **LN-Entropy** offers a balance, providing moderate and relatively stable performance across the temperature range.
* **Perplexity** is insensitive to temperature in this context, suggesting it measures a property of the model or text that is unaffected by the randomness introduced by the temperature parameter.
**Practical Implication:** If one can control or know the temperature of the generated text being evaluated, **EigenScore** is the superior choice for low-temperature settings. For high-temperature or unknown settings, **LN-Entropy** provides more reliable, albeit lower, performance. **Perplexity** appears to be a poor discriminator for the task measured by AUROC in this experiment, as its score does not change with the variable of interest. The chart effectively demonstrates that metric selection must be contingent on the operational conditions (here, temperature).