## Line Chart: Sensitivity to Temperature
### Overview
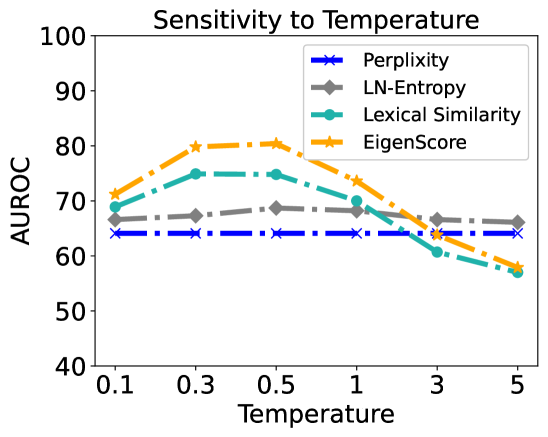
The chart illustrates the sensitivity of four evaluation metrics (Perplexity, LN-Entropy, Lexical Similarity, EigenScore) to temperature variations, measured via Area Under the Receiver Operating Characteristic curve (AUROC). Temperature ranges from 0.1 to 5.0, with AUROC scores plotted on a 40–100 scale. All metrics show distinct trends, with some peaking at intermediate temperatures before declining.
### Components/Axes
- **X-axis (Temperature)**: Logarithmic scale from 0.1 to 5.0, with markers at 0.1, 0.3, 0.5, 1, 3, and 5.
- **Y-axis (AUROC)**: Linear scale from 40 to 100, with increments of 10.
- **Legend**: Located in the top-right corner, associating:
- **Blue (dashed line with stars)**: Perplexity
- **Gray (solid line with diamonds)**: LN-Entropy
- **Teal (dashed line with circles)**: Lexical Similarity
- **Orange (solid line with stars)**: EigenScore
### Detailed Analysis
1. **Perplexity (Blue)**:
- Starts at ~65 AUROC at 0.1 temperature.
- Remains flat until 0.5, then drops sharply to ~60 by 5.0.
- Minimal variability across temperatures.
2. **LN-Entropy (Gray)**:
- Begins at ~67 AUROC at 0.1.
- Peaks at ~69 around 0.5, then declines to ~66 by 5.0.
- Slight upward trend until 0.5, then gradual decline.
3. **Lexical Similarity (Teal)**:
- Starts at ~70 AUROC at 0.1.
- Rises to ~75 at 0.5, then plummets to ~58 by 5.0.
- Sharp decline after 0.5 temperature.
4. **EigenScore (Orange)**:
- Begins at ~72 AUROC at 0.1.
- Peaks at ~80 around 0.5, then falls to ~58 by 5.0.
- Steepest decline among all metrics after 0.5.
### Key Observations
- **EigenScore** achieves the highest AUROC (~80) at 0.5 temperature but drops sharply to ~58 at 5.0.
- **Lexical Similarity** shows the most dramatic decline (~75 → ~58) after 0.5 temperature.
- **LN-Entropy** and **Perplexity** exhibit relative stability, with LN-Entropy maintaining higher scores than Perplexity across all temperatures.
- All metrics decline significantly at higher temperatures (3–5), suggesting reduced performance under extreme conditions.
### Interpretation
The data suggests that **EigenScore** and **Lexical Similarity** are highly sensitive to temperature changes, performing optimally at intermediate temperatures (0.5) but degrading sharply at higher values. This could indicate overfitting or instability in these metrics under extreme conditions. In contrast, **LN-Entropy** and **Perplexity** demonstrate robustness, maintaining consistent performance across temperatures. The sharp declines in EigenScore and Lexical Similarity at high temperatures may highlight their reliance on specific linguistic patterns that become less reliable as temperature increases. These findings could inform metric selection in temperature-sensitive applications, favoring stability over peak performance.