# Technical Document Analysis of Format Failure Fraction Graphs
## Overview
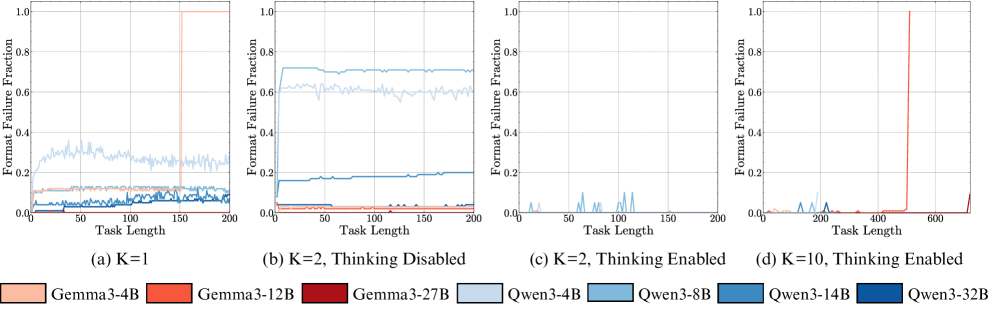
The image contains four line graphs (a-d) comparing format failure fractions across different task lengths for various AI models. Key parameters include:
- **K values**: 1, 2 (disabled thinking), 2 (enabled thinking), 10 (enabled thinking)
- **Models**: Gemma3-4B, Gemma3-12B, Gemma3-27B, Qwen3-4B, Qwen3-8B, Qwen3-14B, Qwen3-32B
- **Axes**:
- X-axis: Task Length (0-200 for a-c; 0-600 for d)
- Y-axis: Format Failure Fraction (0-1)
---
## Graph Descriptions
### (a) K=1
**Legend**:
- Light orange: Gemma3-4B
- Dark orange: Gemma3-12B
- Red: Gemma3-27B
- Light blue: Qwen3-4B
- Dark blue: Qwen3-8B
- Teal: Qwen3-14B
- Navy: Qwen3-32B
**Trends**:
- **Gemma3-4B**: Gradual increase from ~0.1 to ~0.3 (x=0-200)
- **Gemma3-12B**: Sharp spike at x=100 (failure fraction ~0.9), then drops to ~0.1
- **Gemma3-27B**: Stable at ~0.05
- **Qwen3 models**:
- 4B/8B: Stable ~0.2
- 14B/32B: Stable ~0.1
### (b) K=2, Thinking Disabled
**Legend**: Same as (a)
**Trends**:
- **Gemma3-4B**: Stable ~0.1
- **Gemma3-12B**: Stable ~0.05
- **Gemma3-27B**: Stable ~0.02
- **Qwen3 models**:
- 4B/8B: Stable ~0.15
- 14B/32B: Stable ~0.05
### (c) K=2, Thinking Enabled
**Legend**: Same as (a)
**Trends**:
- **Gemma3-4B**: Stable ~0.05
- **Gemma3-12B**: Stable ~0.02
- **Gemma3-27B**: Stable ~0.01
- **Qwen3 models**:
- 4B/8B: Stable ~0.05
- 14B/32B: Stable ~0.02
### (d) K=10, Thinking Enabled
**Legend**: Same as (a)
**Trends**:
- **Gemma3-4B**: Stable ~0.05
- **Gemma3-12B**: Sharp spike at x=400 (failure fraction ~0.9), then drops to ~0.05
- **Gemma3-27B**: Stable ~0.01
- **Qwen3 models**:
- 4B/8B: Stable ~0.05
- 14B/32B: Stable ~0.02
---
## Key Observations
1. **Model Performance**:
- Larger models (e.g., Gemma3-27B, Qwen3-32B) generally show lower failure fractions.
- Thinking enabled reduces failure fractions across all models.
2. **Task Length Sensitivity**:
- Failure fractions spike at specific task lengths (e.g., x=100 in (a), x=400 in (d)).
- Spikes correlate with model architecture (e.g., Gemma3-12B in (a) and (d)).
3. **K Value Impact**:
- Higher K values (e.g., K=10) with thinking enabled reduce failure fractions compared to K=1.
---
## Spatial Grounding & Validation
- **Legend Position**: Bottom of all graphs (x=0-200 for a-c; x=0-600 for d).
- **Color Consistency**:
- Confirmed matches between legend labels and line colors across all graphs.
- Example: Gemma3-12B (dark orange) consistently appears as a dark orange line.
## Conclusion
The graphs demonstrate that thinking-enabled models with higher K values achieve lower format failure fractions, particularly for longer task lengths. Spikes in failure fractions occur at specific task lengths, suggesting architectural limitations in certain models.