## Density Plots: Comparison of Audio Synthesis Methods Across Metrics
### Overview
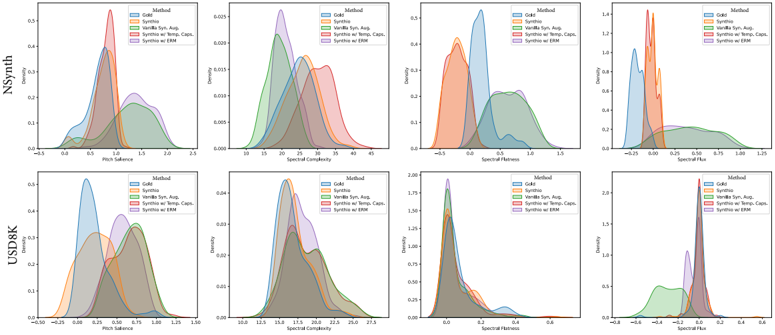
The image contains eight density plots comparing five audio synthesis methods (Gold, Synthia, Vanilla Syn. Avg., Synthia w/ Temp. Caps., Synthia w/ ERM) across four audio metrics (NSynth Pitch Salience, Spectral Complexity, Spectral Flatness, Spectral Flux) for two datasets (NSynth and USD8K). Each subplot visualizes the distribution of a metric's values across methods.
---
### Components/Axes
- **X-Axes**:
- NSynth Pitch Salience: -0.5 to 1.5
- Spectral Complexity: 10 to 45 (NSynth) / 10 to 27.5 (USD8K)
- Spectral Flatness: -0.5 to 1.5
- Spectral Flux: -0.8 to 1.2
- **Y-Axes**: Density (scaled differently per subplot)
- **Legends**: Located in the top-right of each subplot, with color-coded labels for methods.
- **Datasets**:
- Top row: NSynth
- Bottom row: USD8K
---
### Detailed Analysis
#### NSynth Metrics
1. **Pitch Salience**
- **Gold** (blue): Peak at ~0.5, narrow distribution.
- **Synthia** (orange): Peak at ~0.4, slightly broader.
- **Vanilla Syn. Avg.** (green): Broad, flat distribution.
- **Synthia w/ Temp. Caps.** (red): Narrow peak at ~0.3.
- **Synthia w/ ERM** (purple): Broad, multimodal distribution.
2. **Spectral Complexity**
- **Gold**: Peak at ~20, moderate spread.
- **Synthia**: Peak at ~25, wider than Gold.
- **Vanilla Syn. Avg.**: Peak at ~15, narrow.
- **Synthia w/ Temp. Caps.**: Peak at ~30, sharp.
- **Synthia w/ ERM**: Peak at ~20, overlaps with Gold.
3. **Spectral Flatness**
- **Gold**: Peak near 0, sharp.
- **Synthia**: Peak at ~0.2, moderate spread.
- **Vanilla Syn. Avg.**: Peak at ~0.1, narrow.
- **Synthia w/ Temp. Caps.**: Peak at ~0.3, broad.
- **Synthia w/ ERM**: Peak at ~0.1, overlaps with Vanilla.
4. **Spectral Flux**
- **Gold**: Peak at 0, narrow.
- **Synthia**: Peak at ~0.1, moderate.
- **Vanilla Syn. Avg.**: Peak at ~0.05, narrow.
- **Synthia w/ Temp. Caps.**: Peak at ~0.2, broad.
- **Synthia w/ ERM**: Peak at ~0.05, overlaps with Vanilla.
#### USD8K Metrics
1. **Pitch Salience**
- **Gold**: Peak at ~0.5, narrow.
- **Synthia**: Peak at ~0.3, moderate.
- **Vanilla Syn. Avg.**: Peak at ~0.4, broad.
- **Synthia w/ Temp. Caps.**: Peak at ~0.2, narrow.
- **Synthia w/ ERM**: Peak at ~0.3, overlaps with Synthia.
2. **Spectral Complexity**
- **Gold**: Peak at ~15, narrow.
- **Synthia**: Peak at ~17, moderate.
- **Vanilla Syn. Avg.**: Peak at ~12, narrow.
- **Synthia w/ Temp. Caps.**: Peak at ~20, sharp.
- **Synthia w/ ERM**: Peak at ~15, overlaps with Gold.
3. **Spectral Flatness**
- **Gold**: Peak near 0, sharp.
- **Synthia**: Peak at ~0.1, moderate.
- **Vanilla Syn. Avg.**: Peak at ~0.05, narrow.
- **Synthia w/ Temp. Caps.**: Peak at ~0.2, broad.
- **Synthia w/ ERM**: Peak at ~0.05, overlaps with Vanilla.
4. **Spectral Flux**
- **Gold**: Peak at 0, narrow.
- **Synthia**: Peak at ~0.1, moderate.
- **Vanilla Syn. Avg.**: Peak at ~0.05, narrow.
- **Synthia w/ Temp. Caps.**: Peak at ~0.2, broad.
- **Synthia w/ ERM**: Peak at ~0.05, overlaps with Vanilla.
---
### Key Observations
1. **Method-Specific Trends**:
- **Synthia w/ ERM** consistently produces broader distributions, suggesting higher variability in generated audio.
- **Synthia w/ Temp. Caps.** often has sharper, narrower peaks, indicating more consistent outputs.
- **Vanilla Syn. Avg.** shows flatter distributions, implying less variability.
2. **Dataset Differences**:
- USD8K metrics generally have lower peak densities (e.g., Spectral Complexity peaks at ~15 vs. NSynth’s ~20).
- Spectral Flux in USD8K has a y-axis scaled up to 2.0, unlike NSynth’s 0.5, indicating differing data ranges.
3. **Outliers**:
- Synthia w/ Temp. Caps. in USD8K Spectral Complexity peaks at ~20, significantly higher than other methods.
- Synthia w/ ERM in NSynth Spectral Flux overlaps with Vanilla Syn. Avg., suggesting similar performance.
---
### Interpretation
The plots reveal how different synthesis methods affect audio characteristics:
- **ERM (Empirical Risk Minimization)** introduces variability, as seen in broader distributions for Synthia w/ ERM.
- **Temperature Caps.** likely stabilize outputs, resulting in sharper peaks (e.g., Synthia w/ Temp. Caps. in Spectral Complexity).
- **Gold** (real data) serves as a benchmark, with Synthia methods sometimes aligning closely (e.g., Spectral Complexity in USD8K) or diverging (e.g., Spectral Flux in NSynth).
The dataset-specific differences (NSynth vs. USD8K) highlight how synthesis methods perform across distinct audio domains. For instance, USD8K’s lower Spectral Complexity peaks may reflect simpler audio structures compared to NSynth.
These insights suggest that method choice (e.g., ERM vs. Temp. Caps.) and dataset characteristics jointly influence audio quality and consistency.