\n
## Chart: Importance Score over Reasoning Steps
### Overview
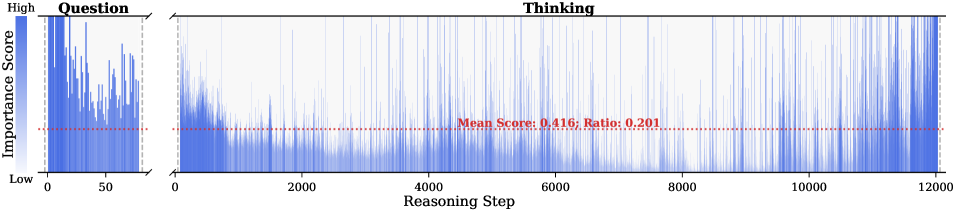
The image presents a chart visualizing the "Importance Score" over "Reasoning Steps". The chart appears to represent the fluctuation of importance during a question-answering or problem-solving process, divided into "Question" and "Thinking" phases. The chart is a time series, with the x-axis representing the reasoning step and the y-axis representing the importance score. A horizontal dashed line indicates the mean importance score.
### Components/Axes
* **X-axis:** "Reasoning Step", ranging from approximately 0 to 12000.
* **Y-axis:** "Importance Score", ranging from "Low" to "High". The scale is not explicitly numerical, but visually represents a gradient.
* **Title/Labels:** The chart is divided into two sections labeled "Question" (from 0 to approximately 50 Reasoning Steps) and "Thinking" (from approximately 50 to 12000 Reasoning Steps).
* **Horizontal Line:** A dashed red horizontal line is present, labeled "Mean Score: 0.416; Ratio: 0.201".
* **Color Scheme:** The chart uses a blue gradient to represent the importance score, with darker blues indicating higher scores and lighter blues indicating lower scores.
### Detailed Analysis
The chart displays a fluctuating importance score over the reasoning steps.
* **Question Phase (0-50 Reasoning Steps):** The importance score exhibits high variability, with frequent peaks and troughs. The score fluctuates rapidly between "Low" and "High".
* **Thinking Phase (50-12000 Reasoning Steps):** The importance score remains generally lower than in the "Question" phase, with more frequent values closer to the "Low" end of the scale. The fluctuations are still present, but the amplitude appears reduced compared to the "Question" phase. The score oscillates around the mean score.
* **Mean Score:** The mean importance score is 0.416, with a ratio of 0.201. The ratio is not defined in the image.
* **Visual Trend:** The "Question" phase shows a burst of activity, while the "Thinking" phase shows a more sustained, but lower-amplitude, oscillation.
### Key Observations
* The importance score is significantly higher and more volatile during the "Question" phase compared to the "Thinking" phase.
* The mean importance score provides a baseline for comparison, and the majority of the "Thinking" phase data points appear to fall around this value.
* The ratio of 0.201 is provided alongside the mean score, but its meaning is not explained in the image.
### Interpretation
The chart suggests that the initial stage of problem-solving ("Question") involves a higher degree of fluctuating importance, potentially reflecting the exploration of different potential approaches or the identification of key information. As the reasoning process progresses into the "Thinking" phase, the importance score stabilizes and generally decreases, indicating a more focused and consistent line of thought. The high variability in the "Question" phase could represent the initial uncertainty and exploration, while the lower variability in the "Thinking" phase suggests a more refined and directed reasoning process. The mean score and ratio provide quantitative measures of the overall importance and potentially the efficiency of the reasoning process, but the meaning of the ratio requires further context. The chart demonstrates a clear distinction between the initial exploratory phase and the subsequent focused reasoning phase.