## Line Chart: Importance Score Across Reasoning Steps
### Overview
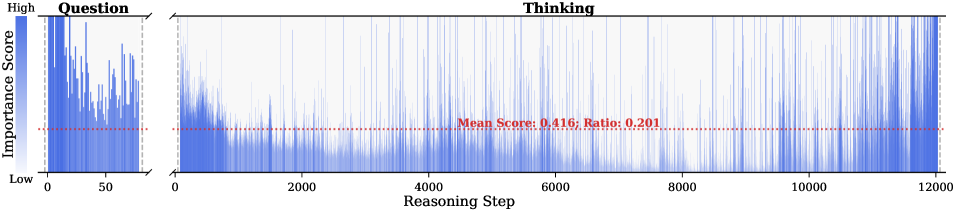
The image is a line chart divided into two sections: "Question" (left) and "Thinking" (right). It visualizes the distribution of "Importance Score" across "Reasoning Steps" (0–12,000). A red dashed line labeled "Mean Score: 0.416; Ratio: 0.201" spans the chart horizontally. The y-axis ranges from "Low" to "High" importance scores, with blue vertical lines representing data points.
### Components/Axes
- **X-axis (Reasoning Step)**: Labeled "Reasoning Step" with a scale from 0 to 12,000.
- **Y-axis (Importance Score)**: Labeled "Importance Score" with a gradient from "Low" (bottom) to "High" (top).
- **Legend**: Located in the top-left corner, with a blue color representing "Importance Score."
- **Red Dashed Line**: Horizontal line labeled "Mean Score: 0.416; Ratio: 0.201," positioned at approximately 40% of the y-axis height.
### Detailed Analysis
- **Question Section (Left)**:
- Dense cluster of vertical blue lines concentrated near the left edge (0–500 reasoning steps).
- Scores drop sharply after 500 steps, with minimal activity beyond this point.
- **Thinking Section (Right)**:
- Sparse, scattered blue lines distributed across the entire x-axis (0–12,000).
- No clear clustering; scores vary widely, with some peaks and troughs.
- **Red Dashed Line**:
- Positioned at ~40% of the y-axis, indicating a moderate mean importance score.
- The ratio "0.201" suggests a proportional relationship (e.g., 20.1% of steps fall below the mean).
### Key Observations
1. **Initial Focus on "Question"**: High importance scores are concentrated in the early reasoning steps (0–500), suggesting critical analysis occurs early.
2. **Divergence in "Thinking"**: Later steps (500–12,000) show lower and more variable importance scores, indicating less consistent or exploratory reasoning.
3. **Mean and Ratio**: The mean score of 0.416 (mid-range) and ratio of 0.201 imply that ~20% of steps fall below the average importance.
### Interpretation
The chart highlights a stark contrast between the "Question" and "Thinking" phases. The early "Question" phase is characterized by high, concentrated importance scores, likely reflecting structured or critical analysis. In contrast, the "Thinking" phase exhibits lower and more dispersed scores, suggesting a shift toward exploratory or less focused reasoning. The mean score of 0.416 and ratio of 0.201 indicate that while the average importance is moderate, a significant portion of steps (20.1%) are below this threshold, pointing to potential inefficiencies or variability in later reasoning stages. This could imply that the model prioritizes initial problem framing over sustained, nuanced analysis.