# Technical Document Extraction: Programming Language Adoption Analysis
## Chart Type
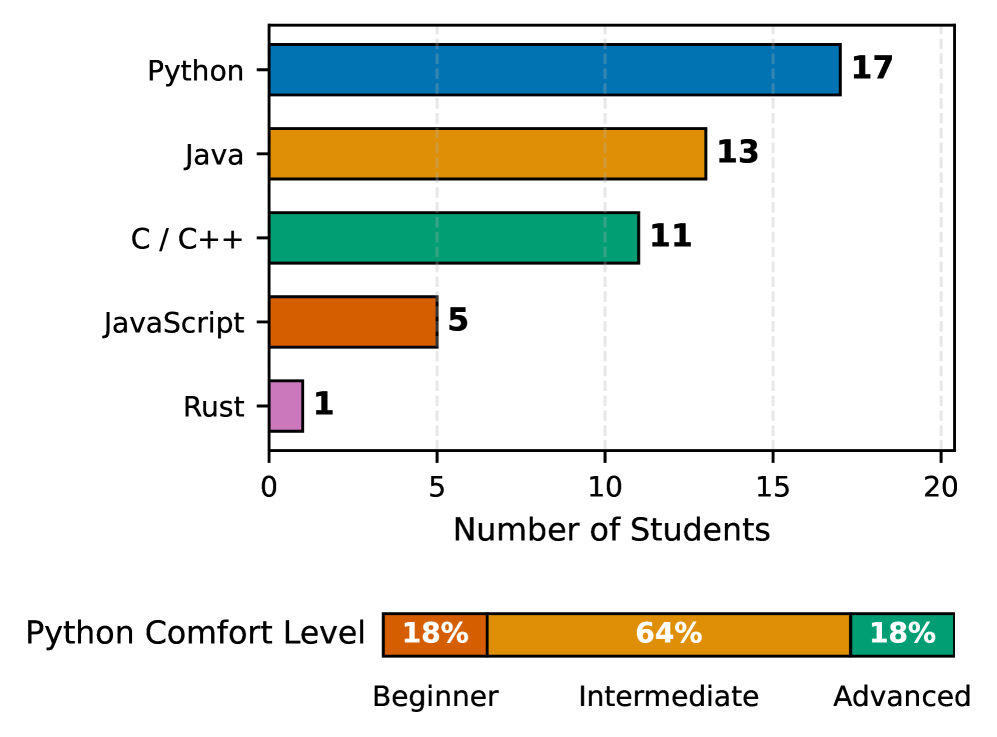
Horizontal bar chart comparing programming language adoption among students.
## Labels and Axis Titles
- **X-Axis**: "Number of Students" (numerical scale: 0–20)
- **Y-Axis**: Programming languages (categorical):
- Python
- Java
- C / C++
- JavaScript
- Rust
## Legend
- **Location**: Bottom of the chart
- **Content**:
- **Python Comfort Level**:
- Beginner: 18% (orange)
- Intermediate: 64% (yellow)
- Advanced: 18% (green)
## Data Points and Trends
1. **Python**:
- **Value**: 17 students
- **Trend**: Longest bar (highest adoption)
- **Color**: Blue (matches legend's "Python Comfort Level" category)
2. **Java**:
- **Value**: 13 students
- **Trend**: Second-longest bar
- **Color**: Orange
3. **C / C++**:
- **Value**: 11 students
- **Trend**: Third-longest bar
- **Color**: Green
4. **JavaScript**:
- **Value**: 5 students
- **Trend**: Short bar (low adoption)
- **Color**: Red
5. **Rust**:
- **Value**: 1 student
- **Trend**: Shortest bar (lowest adoption)
- **Color**: Purple
## Spatial Grounding
- **Legend Position**: Bottom-center (aligned with x-axis)
- **Bar Colors**:
- Python: Blue (distinct from legend colors)
- Java: Orange (matches legend's "Beginner" color)
- C / C++: Green (matches legend's "Advanced" color)
- JavaScript: Red (no legend match)
- Rust: Purple (no legend match)
## Component Isolation
1. **Header**: Chart title (not explicitly labeled but inferred from context)
2. **Main Chart**:
- Bars represent student counts per language
- Legend explains Python-specific comfort levels
3. **Footer**: No explicit footer elements
## Data Table Reconstruction
| Programming Language | Number of Students | Color |
|----------------------|--------------------|--------|
| Python | 17 | Blue |
| Java | 13 | Orange |
| C / C++ | 11 | Green |
| JavaScript | 5 | Red |
| Rust | 1 | Purple |
## Trend Verification
- **Descending Order**: Python (17) > Java (13) > C / C++ (11) > JavaScript (5) > Rust (1)
- **Python Comfort Levels**:
- Beginner (18%) and Advanced (18%) are equal
- Intermediate (64%) dominates
## Language Notes
- All textual content is in English.
- No non-English text detected.
## Critical Observations
1. Python dominates adoption (17 students), with balanced comfort levels across skill tiers.
2. Java and C / C++ show moderate adoption but lack comfort-level data.
3. JavaScript and Rust have minimal adoption (5 and 1 students, respectively).
4. Legend colors for Python comfort levels do not correspond to bar colors for other languages.