## Line Chart: Shannon and Bayesian Surprises
### Overview
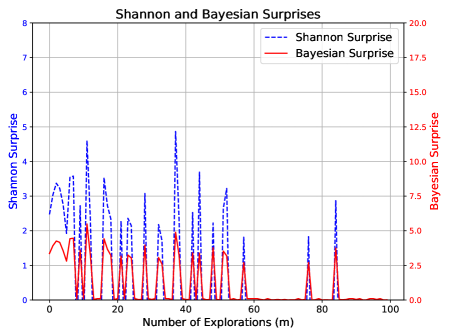
The image is a line chart comparing Shannon Surprise and Bayesian Surprise over a number of explorations. The x-axis represents the "Number of Explorations (m)" ranging from 0 to 100. The left y-axis represents "Shannon Surprise" ranging from 0 to 8, while the right y-axis represents "Bayesian Surprise" ranging from 0.0 to 20.0. The Shannon Surprise is represented by a dashed blue line, and the Bayesian Surprise is represented by a solid red line.
### Components/Axes
* **Title:** Shannon and Bayesian Surprises
* **X-axis:**
* Label: Number of Explorations (m)
* Range: 0 to 100
* Ticks: 0, 20, 40, 60, 80, 100
* **Left Y-axis:**
* Label: Shannon Surprise
* Range: 0 to 8
* Ticks: 0, 1, 2, 3, 4, 5, 6, 7, 8
* **Right Y-axis:**
* Label: Bayesian Surprise
* Range: 0.0 to 20.0
* Ticks: 0.0, 2.5, 5.0, 7.5, 10.0, 12.5, 15.0, 17.5, 20.0
* **Legend:** Located in the top-right corner.
* Shannon Surprise: Dashed blue line
* Bayesian Surprise: Solid red line
### Detailed Analysis
* **Shannon Surprise (Dashed Blue Line):**
* Trend: Highly variable, with several peaks and troughs, generally decreasing after around exploration 40.
* Approximate Data Points:
* Exploration 0: ~2.5
* Exploration 10: ~3.5
* Exploration 20: ~2.0
* Exploration 30: ~3.5
* Exploration 40: ~5.0
* Exploration 50: ~2.0
* Exploration 60: ~1.0
* Exploration 70: ~0.5
* Exploration 80: ~2.5
* Exploration 90: ~1.0
* Exploration 100: ~0.2
* **Bayesian Surprise (Solid Red Line):**
* Trend: Generally low with occasional spikes, decreasing to near zero after exploration 60.
* Approximate Data Points:
* Exploration 0: ~4.0
* Exploration 5: ~3.0
* Exploration 10: ~1.0
* Exploration 20: ~3.0
* Exploration 30: ~1.0
* Exploration 40: ~2.0
* Exploration 50: ~3.0
* Exploration 60: ~0.1
* Exploration 70: ~0.1
* Exploration 80: ~0.1
* Exploration 90: ~0.1
* Exploration 100: ~0.1
### Key Observations
* The Shannon Surprise exhibits more frequent and larger fluctuations compared to the Bayesian Surprise.
* Both Shannon and Bayesian Surprise tend to decrease as the number of explorations increases, especially after exploration 60.
* The Bayesian Surprise is generally lower than the Shannon Surprise, except for the initial explorations.
### Interpretation
The chart illustrates how Shannon and Bayesian Surprises change with an increasing number of explorations. The Shannon Surprise, which measures information gain, shows high variability, suggesting that the agent frequently encounters unexpected information. The Bayesian Surprise, which measures the change in belief, is generally lower and decreases more consistently, indicating that the agent's beliefs stabilize as it explores the environment. The decrease in both surprises over time suggests that the agent is learning and becoming more familiar with the environment, leading to fewer unexpected events and smaller belief updates. The spikes in Bayesian Surprise indicate specific instances where the agent's beliefs were significantly altered, possibly due to encountering critical new information.