# Technical Document Analysis: Accuracy vs Context Length Graph
## 1. Title and Axes
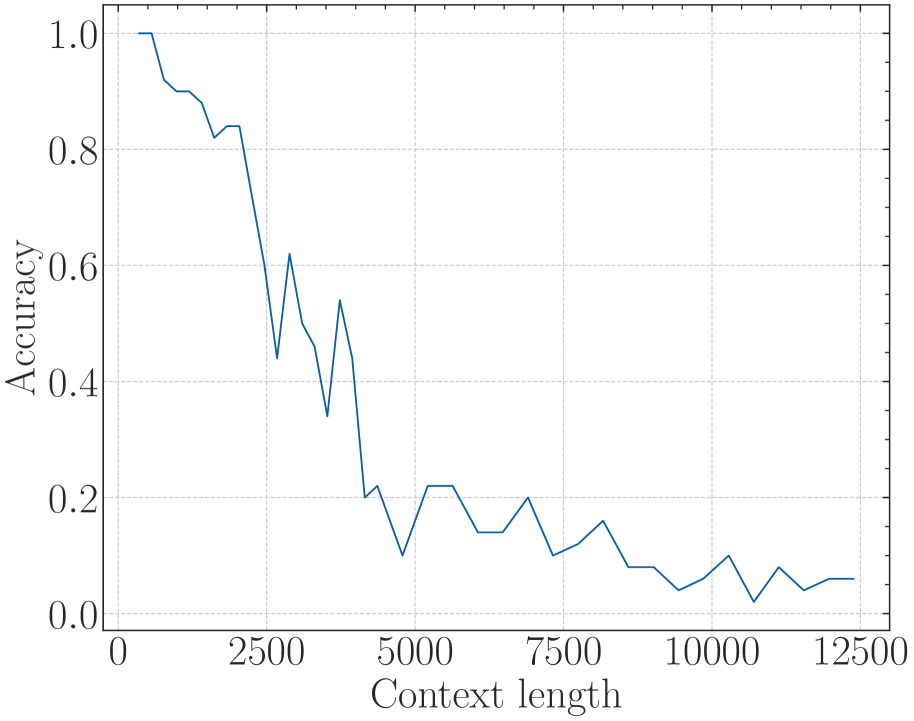
- **Title**: "Accuracy vs Context length"
- **X-axis**:
- Label: "Context length"
- Range: 0 to 12500 (in increments of 2500)
- Markers: 0, 2500, 5000, 7500, 10000, 12500
- **Y-axis**:
- Label: "Accuracy"
- Range: 0.0 to 1.0 (in increments of 0.2)
- Markers: 0.0, 0.2, 0.4, 0.6, 0.8, 1.0
## 2. Data Series and Trends
- **Line Characteristics**:
- Color: Blue
- Style: Solid line with sharp peaks/troughs
- Trend: General downward slope with fluctuations
- **Key Data Points**:
- [0, 1.0]: Starts at maximum accuracy (1.0) at context length 0.
- [1000, ~0.8]: Sharp decline to ~0.8 at context length 1000.
- [2500, ~0.6]: Further drop to ~0.6 at context length 2500.
- [5000, ~0.4]: Steeper decline to ~0.4 at context length 5000.
- [7500, ~0.2]: Continued drop to ~0.2 at context length 7500.
- [10000, ~0.05–0.1]: Stabilizes near 0.05–0.1 between context lengths 10000–12500.
## 3. Observations
- **Initial Stability**: Accuracy remains near 1.0 for the first ~500 context length units.
- **Rapid Decline**: Sharp drop from 1.0 to ~0.4 between context lengths 0–5000.
- **Fluctuations**: Minor peaks/troughs observed between context lengths 2500–7500 (e.g., ~0.6 at 2500, ~0.5 at 3000, ~0.3 at 4000).
- **Final Stabilization**: Accuracy plateaus near 0.05–0.1 for context lengths ≥10000.
## 4. Structural Components
- **Header**: Title centered at the top.
- **Main Chart**:
- Grid: Light gray dashed lines.
- Axes: Bold black lines with labeled ticks.
- **Footer**: No explicit footer present.
## 5. Missing Elements
- **Legend**: Not present.
- **Data Table**: Not applicable (no embedded table).
## 6. Conclusion
The graph illustrates a **general decline in accuracy** as context length increases, with notable fluctuations in the intermediate range (2500–7500). Accuracy stabilizes at a low level (~0.05–0.1) for very long context lengths (≥10000). No legends or additional data sources are provided.