# Technical Document Extraction: Accuracy vs. Context Length Chart
## 1. Component Isolation
* **Header:** None present.
* **Main Chart Area:** A line graph plotted on a Cartesian coordinate system with a light gray dashed grid.
* **Footer/Axes:** Contains the X-axis label "Context length" and the Y-axis label "Accuracy".
## 2. Axis and Label Extraction
* **Y-Axis (Vertical):**
* **Label:** Accuracy
* **Scale:** 0.0 to 1.0
* **Major Tick Markers:** 0.0, 0.2, 0.4, 0.6, 0.8, 1.0
* **X-Axis (Horizontal):**
* **Label:** Context length
* **Scale:** 0 to 12500
* **Major Tick Markers:** 0, 2500, 5000, 7500, 10000, 12500
## 3. Data Series Analysis
* **Series Name:** Not explicitly labeled (Single series).
* **Color:** Dark Blue.
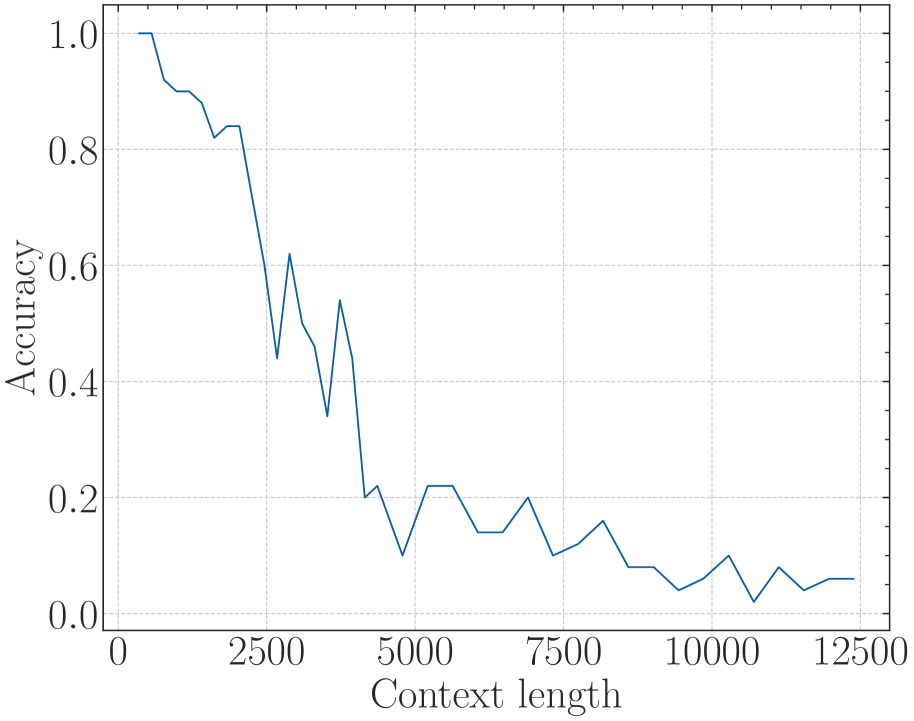
* **Trend Verification:** The line shows a strong **negative correlation**. It begins at a maximum accuracy of 1.0 at the shortest context length and slopes sharply downward. There is significant volatility (jagged peaks and valleys) between context lengths 2500 and 5000. After 5000, the decline continues at a shallower rate, eventually flattening out near the 0.0 to 0.1 accuracy range as it approaches a context length of 12500.
## 4. Data Point Extraction (Estimated)
Based on the visual alignment with the grid and axis markers:
| Context Length (X) | Accuracy (Y) | Observations |
| :--- | :--- | :--- |
| ~500 | 1.0 | Peak performance |
| ~1000 | 0.9 | Initial drop |
| ~2000 | 0.84 | Local plateau |
| ~2500 | 0.6 | Sharp decline begins |
| ~2700 | 0.44 | Local minimum |
| ~3000 | 0.62 | Significant recovery spike |
| ~3500 | 0.34 | Sharp drop |
| ~3800 | 0.54 | Secondary recovery spike |
| ~4200 | 0.2 | Drop below 0.25 threshold |
| 5000 | ~0.1 | Local minimum |
| 5000 - 6000 | 0.22 | Small plateau/recovery |
| 7500 | ~0.1 | Continued decline |
| 10000 | ~0.05 | Near-zero accuracy |
| 12500 | ~0.06 | Final data point; terminal low |
## 5. Summary of Information
This chart illustrates the performance degradation of a system (likely a Large Language Model or similar information retrieval system) as the input "Context length" increases.
* **High Performance Zone:** Context lengths < 2000 (Accuracy > 0.8).
* **Transition/Instability Zone:** Context lengths 2500 to 4500 (Accuracy fluctuates wildly between 0.6 and 0.2).
* **Failure Zone:** Context lengths > 5000 (Accuracy consistently remains below 0.2, indicating the system loses the ability to process or retrieve information accurately at this scale).