## Heatmap: Meta Token #2 • Past Cosine-Sim (Padded)
### Overview
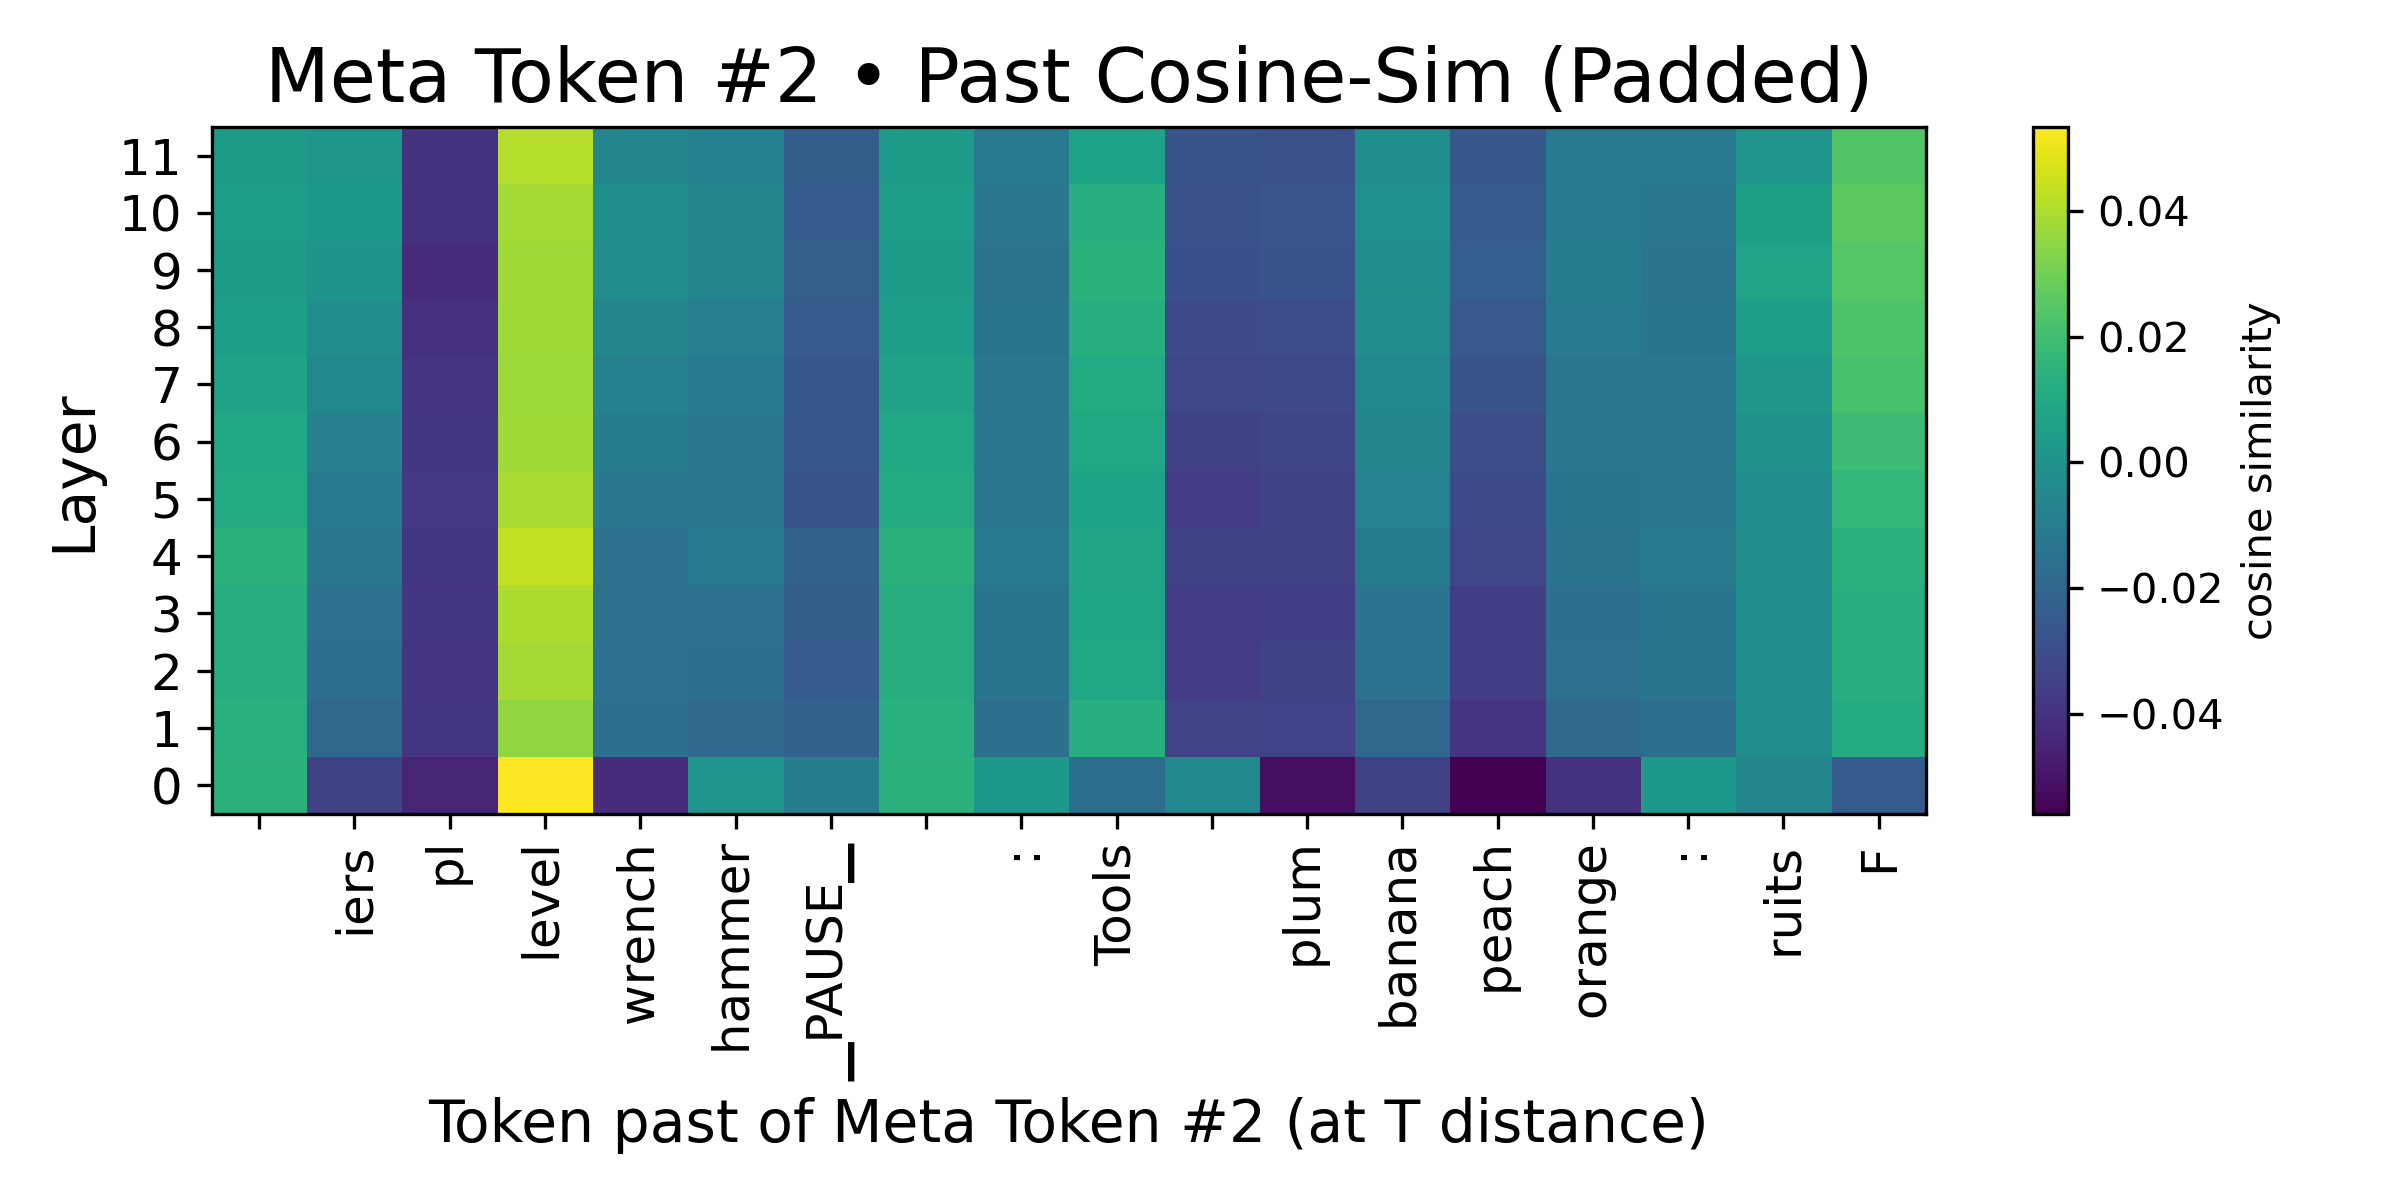
This heatmap visualizes cosine similarity values between Meta Token #2 and other tokens across 12 layers (0–11). The color gradient ranges from purple (-0.04) to yellow (+0.04), with values padded to ensure consistent dimensions. The x-axis represents tokens in the sequence preceding Meta Token #2, while the y-axis represents layers in a neural network or transformer architecture.
### Components/Axes
- **Y-axis (Layer)**: Labeled "Layer" with integer values 0–11.
- **X-axis (Token past of Meta Token #2)**: Tokens include:
`iers`, `pl`, `level`, `wrench`, `hammer`, `PAUSE_`, `:`, `Tools`, `plum`, `banana`, `peach`, `orange`, `:`, `ruits`, `F`.
- **Color Bar**: Labeled "cosine similarity" with values from -0.04 (dark purple) to +0.04 (bright yellow).
### Detailed Analysis
- **Highest Similarity**:
- **Layer 0, Token "level"**: Bright yellow (≈+0.04), indicating the strongest positive cosine similarity.
- **Layer 1, Token "level"**: Yellow-green (≈+0.03), slightly lower than Layer 0.
- **Lowest Similarity**:
- **Layer 11, Token "plum"**: Dark purple (≈-0.04), the most negative value.
- **Layer 10, Token "plum"**: Dark purple (≈-0.03), also highly negative.
- **Neutral Values**:
- Tokens like `PAUSE_`, `Tools`, and `:` show mid-range values (green to teal, ≈0.00–0.02).
- **Vertical Gradients**:
- Token "level" shows a gradient from yellow (Layer 0) to teal (Layer 11), suggesting diminishing similarity with depth.
- Token "plum" shows a gradient from teal (Layer 0) to dark purple (Layer 11), indicating increasing dissimilarity.
### Key Observations
1. **Layer 0 Dominance**: Layer 0 consistently shows the highest similarity magnitudes (both positive and negative).
2. **Token "level"**: Exhibits the strongest positive similarity across early layers, dropping to neutral by Layer 11.
3. **Token "plum"**: Shows the strongest negative similarity in later layers (10–11), with minimal presence in earlier layers.
4. **Padding Artifacts**: The "PAUSE_" token and repeated colons (`:`) appear in mid-layers with moderate similarity, possibly indicating structural padding.
### Interpretation
The heatmap suggests that Meta Token #2’s cosine similarity with preceding tokens varies significantly across layers. The token "level" is most closely associated with Meta Token #2 in early layers (0–1), while "plum" becomes increasingly dissimilar in deeper layers. This could reflect:
- **Token Positioning**: Early layers capture semantic relationships (e.g., "level" as a key contextual token), while later layers focus on syntactic or structural patterns.
- **Padding Impact**: The presence of "PAUSE_" and colons may indicate artificial separation in the sequence, affecting similarity distributions.
- **Layer-Specific Dynamics**: Layer 0’s high similarity magnitudes suggest it encodes strong contextual relationships, while deeper layers may prioritize disentangling or abstracting features.
The data implies that Meta Token #2’s representation is most stable in early layers, with diminishing similarity as layers progress, potentially due to hierarchical feature extraction in the model.