## Heatmap: Meta Token #2 • Past Cosine-Sim (Padded)
### Overview
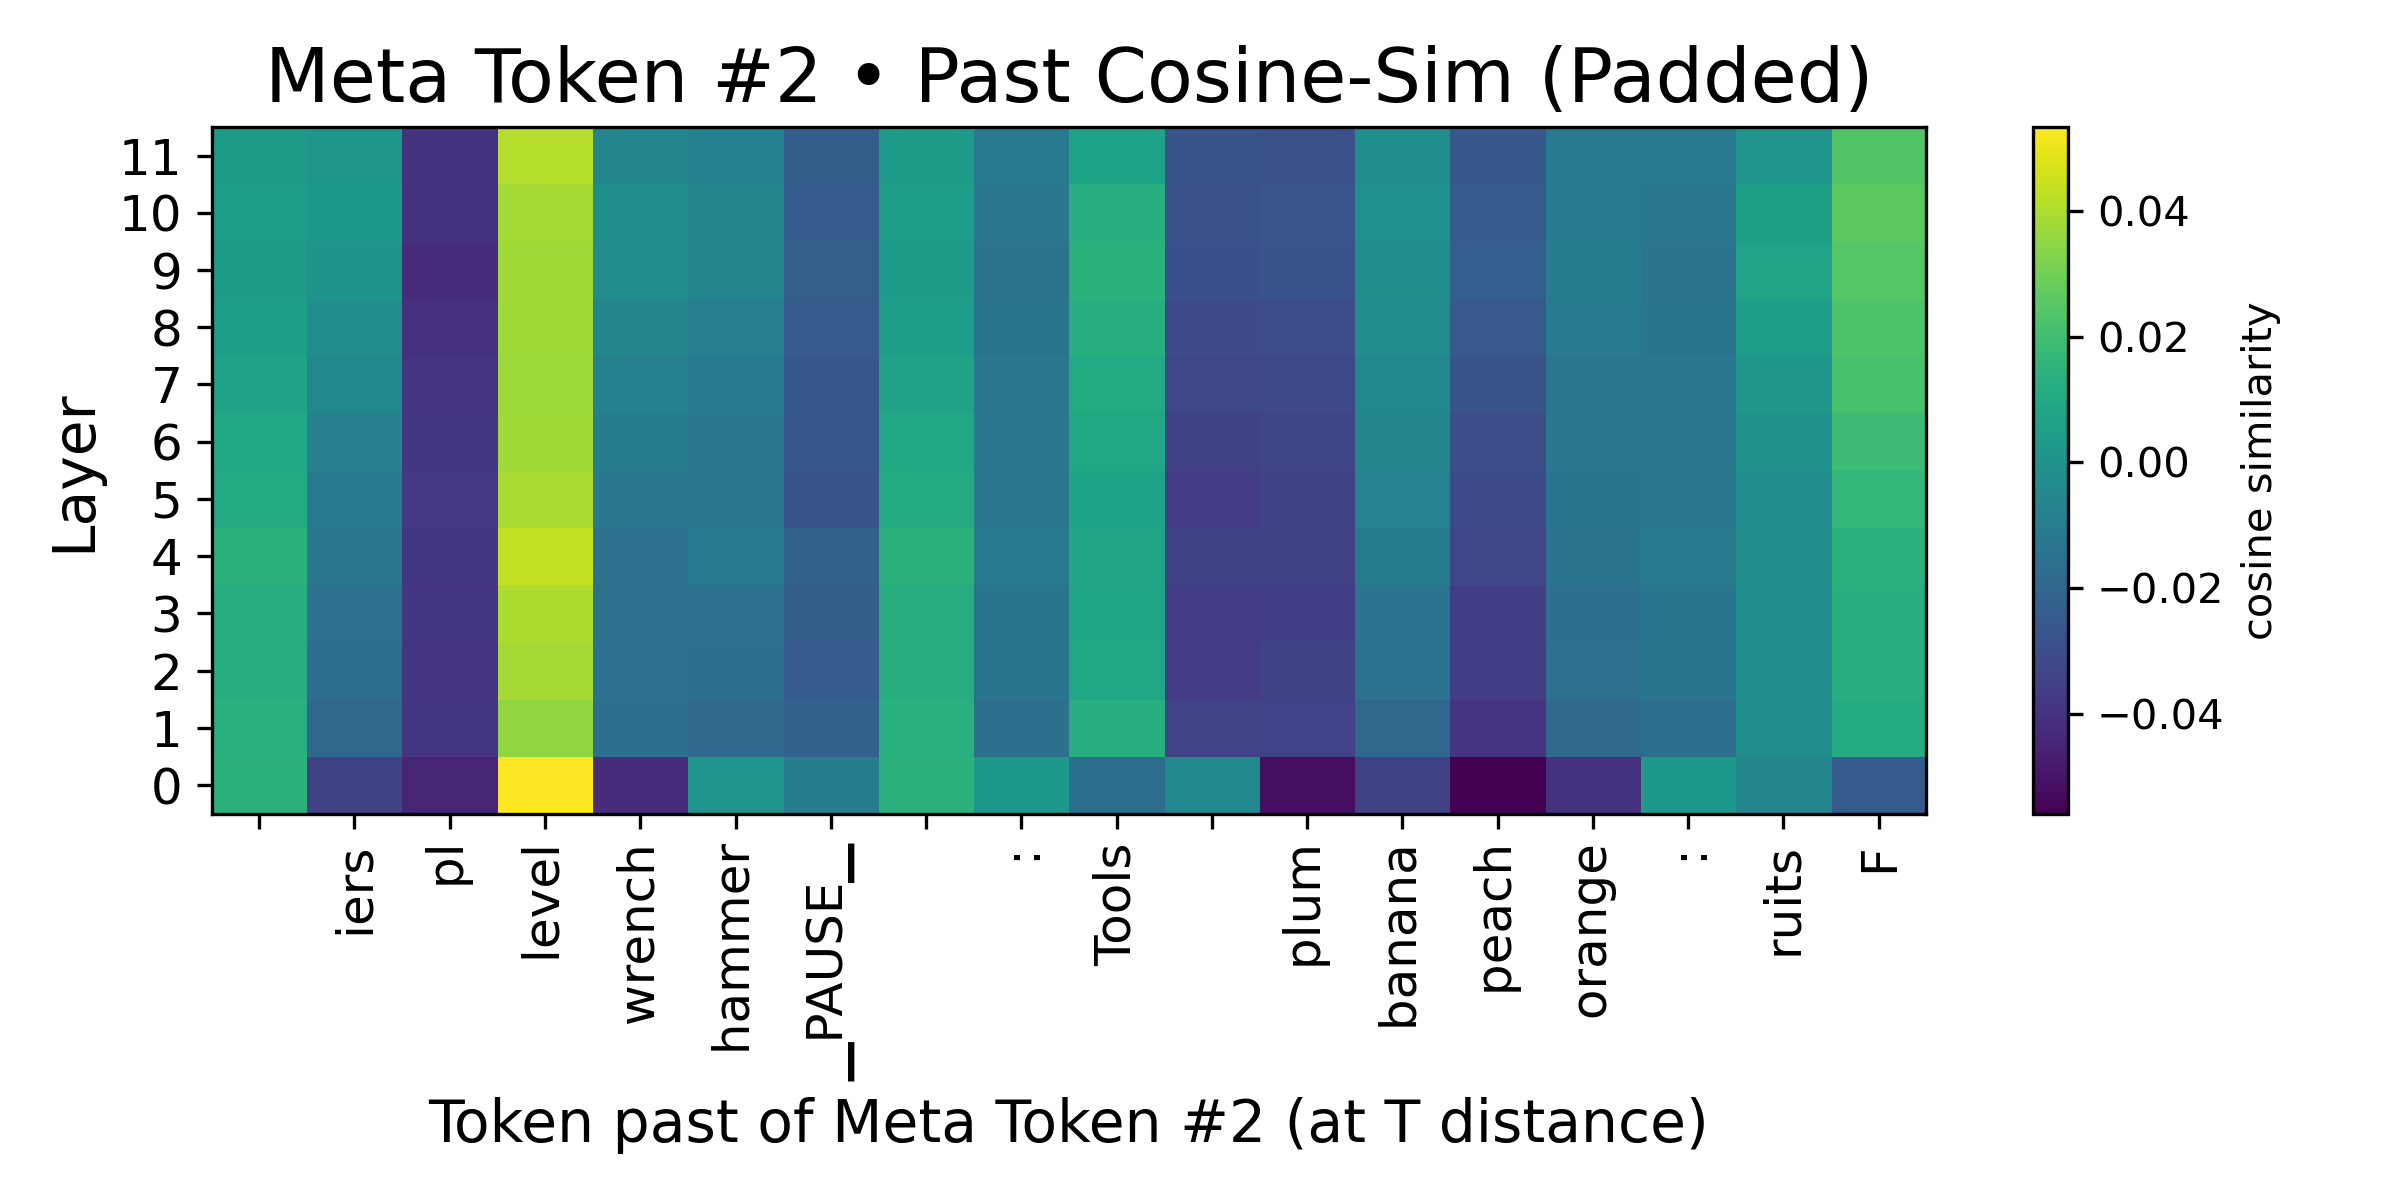
The image is a heatmap visualizing the cosine similarity between the "Meta Token #2" and tokens appearing after it at a certain distance (T distance). The Y-axis represents the layer number (from 0 to 11), and the X-axis represents the tokens following "Meta Token #2". The color intensity indicates the cosine similarity, ranging from -0.04 (dark purple) to 0.04 (yellow).
### Components/Axes
* **Title:** Meta Token #2 • Past Cosine-Sim (Padded)
* **X-axis:** Token past of Meta Token #2 (at T distance)
* Categories: "iers", "pl", "level", "wrench", "hammer", "PAUSE_", ":", "Tools", "plum", "banana", "peach", "orange", ":", "ruits", "F"
* **Y-axis:** Layer
* Scale: 0 to 11 (integers)
* **Colorbar (located on the right):** cosine similarity
* Scale: -0.04 to 0.04
* Markers: -0.04, -0.02, 0.00, 0.02, 0.04
### Detailed Analysis
The heatmap displays the cosine similarity values for each layer (0-11) and each token following "Meta Token #2".
* **"iers"**: The cosine similarity is around 0.00 to 0.02 across all layers.
* **"pl"**: The cosine similarity is around 0.00 to 0.02 across all layers.
* **"level"**: The cosine similarity is high (around 0.04) for layers 0-4, then decreases to around 0.02 for layers 5-11.
* **"wrench"**: The cosine similarity is around 0.00 to 0.02 across all layers.
* **"hammer"**: The cosine similarity is around 0.00 to 0.02 across all layers.
* **"PAUSE_"**: The cosine similarity is around 0.00 to 0.02 across all layers.
* **":" (first instance)**: The cosine similarity is around 0.00 to 0.02 across all layers.
* **"Tools"**: The cosine similarity is around 0.00 to 0.02 across all layers.
* **"plum"**: The cosine similarity is around -0.02 to 0.00 across all layers.
* **"banana"**: The cosine similarity is around -0.02 to 0.00 across all layers.
* **"peach"**: The cosine similarity is around -0.04 to -0.02 across all layers.
* **"orange"**: The cosine similarity is around -0.02 to 0.00 across all layers.
* **":" (second instance)**: The cosine similarity is around 0.00 to 0.02 across all layers.
* **"ruits"**: The cosine similarity is around 0.00 to 0.02 across all layers.
* **"F"**: The cosine similarity is around 0.00 to 0.02 across all layers.
### Key Observations
* The token "level" shows a significantly higher cosine similarity in the lower layers (0-4) compared to other tokens.
* The tokens "plum", "banana", "peach", and "orange" show negative cosine similarity values.
* The cosine similarity values for most tokens are relatively consistent across different layers, with the exception of "level".
### Interpretation
The heatmap visualizes how similar the representation of "Meta Token #2" is to the representation of tokens that follow it in a sequence, across different layers of a model. The high cosine similarity for "level" in the lower layers suggests that "Meta Token #2" might be strongly related to "level" in the initial processing stages. The negative cosine similarity for some tokens indicates that their representations are dissimilar to "Meta Token #2". The consistency of cosine similarity across layers for most tokens suggests that their relationship with "Meta Token #2" doesn't change much as the information propagates through the network.