## Heatmap: Meta Token #2 • Past Cosine-Sim (Padded)
### Overview
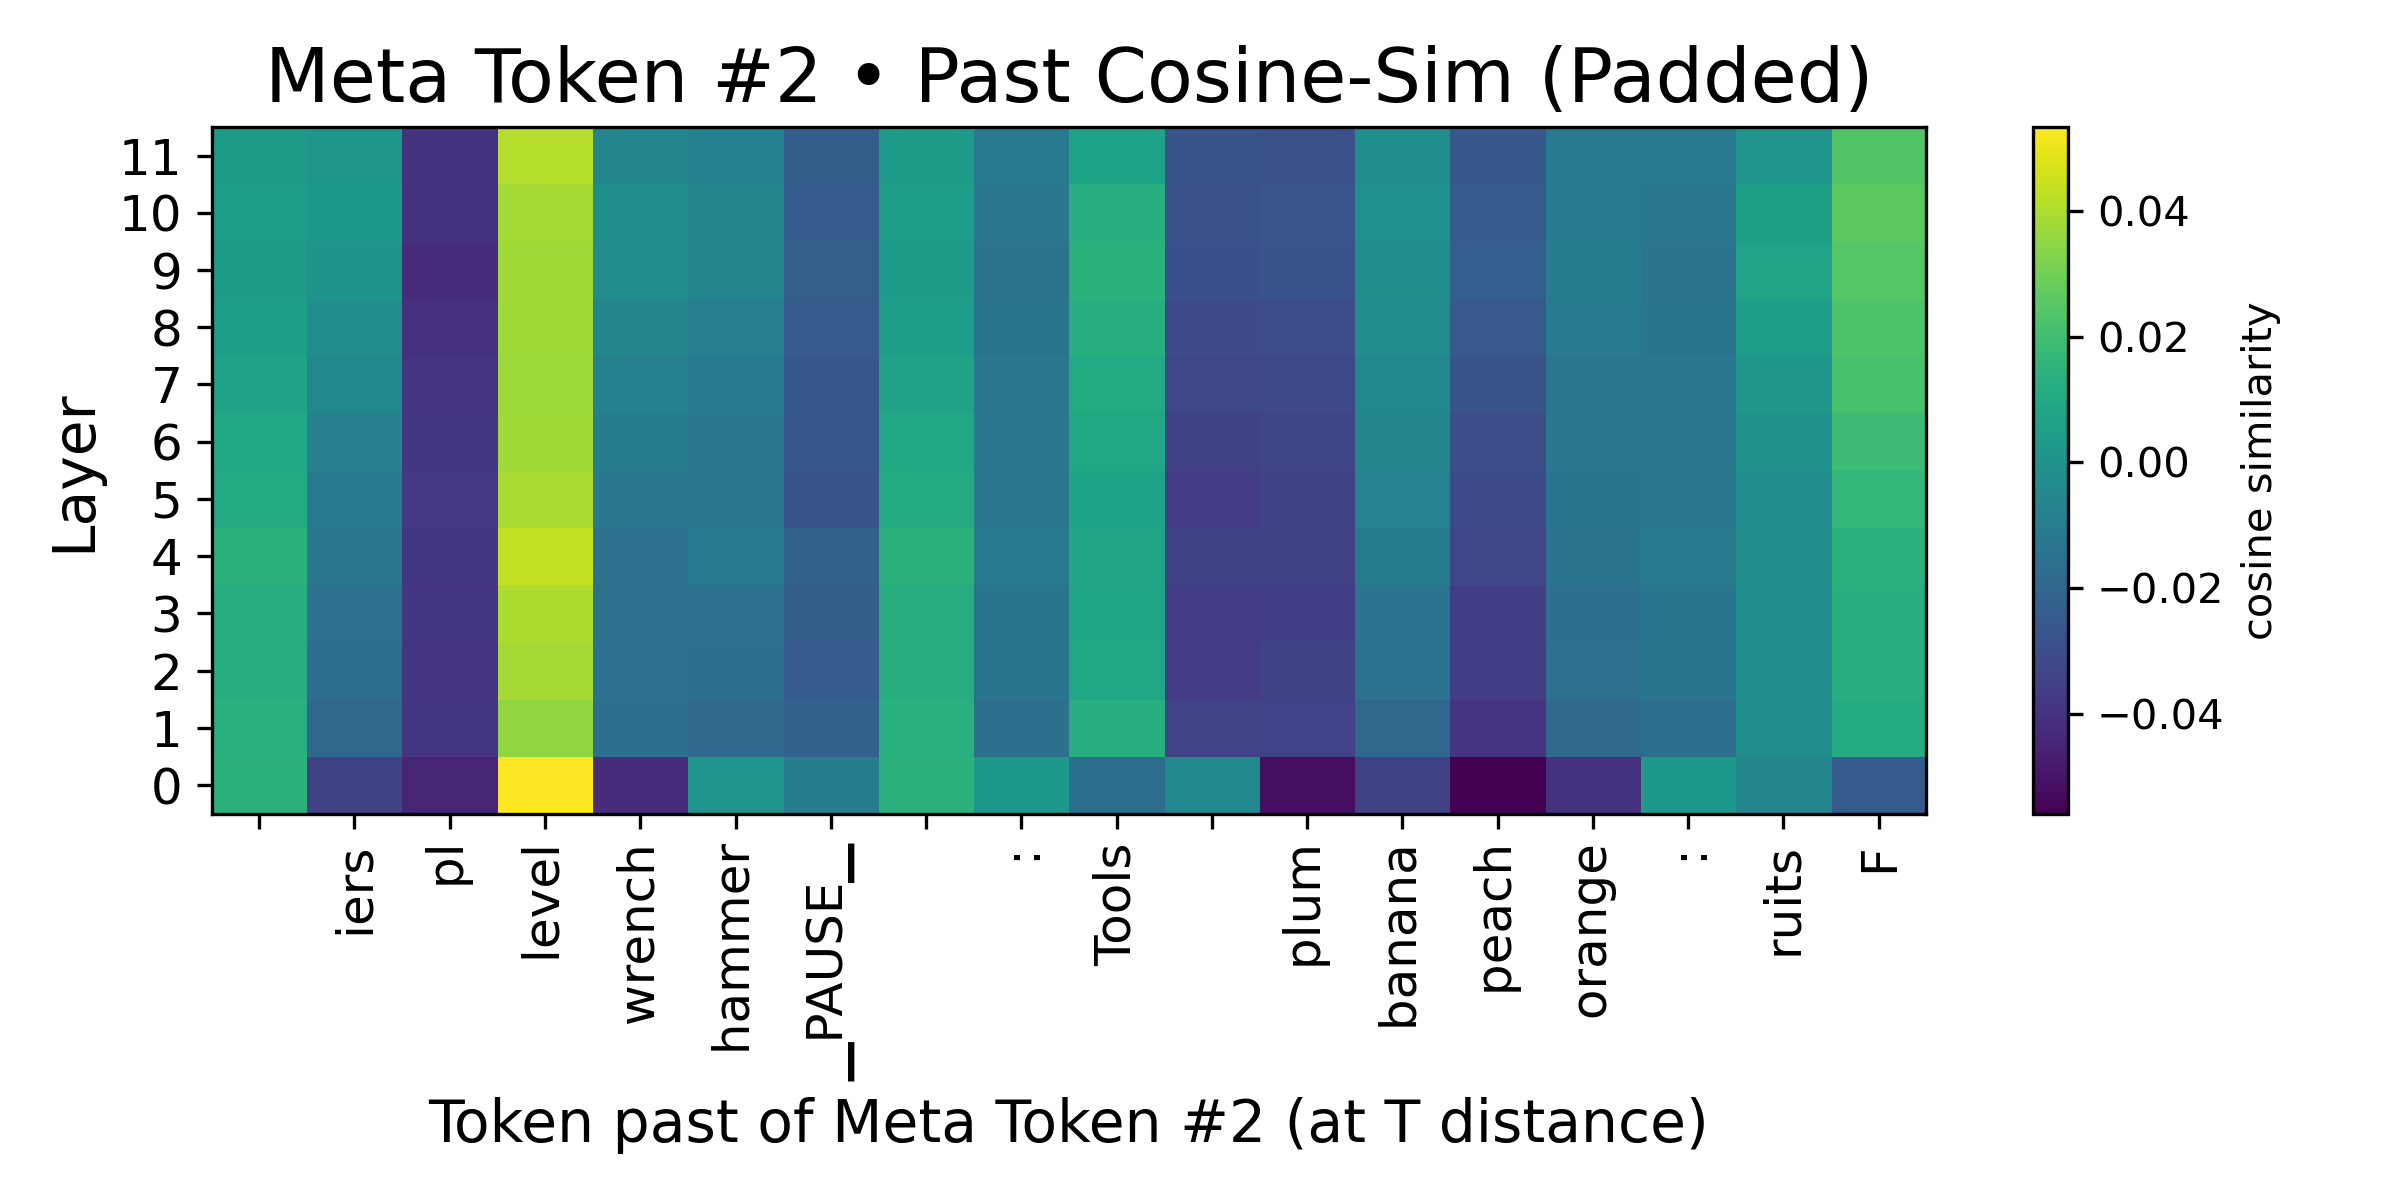
This image presents a heatmap visualizing the cosine similarity between Meta Token #2 and preceding tokens at varying layers. The heatmap is color-coded to represent cosine similarity values, ranging from approximately -0.04 to 0.04. The x-axis represents tokens past Meta Token #2 at a distance of T, and the y-axis represents the layer number.
### Components/Axes
* **Title:** "Meta Token #2 • Past Cosine-Sim (Padded)" - positioned at the top-center.
* **X-axis Label:** "Token past of Meta Token #2 (at T distance)" - positioned at the bottom-center.
* **Y-axis Label:** "Layer" - positioned on the left-center.
* **Colorbar Label:** "cosine similarity" - positioned on the right side.
* **Colorbar Scale:** Ranges from approximately -0.04 (purple) to 0.04 (yellow).
* **X-axis Categories (Tokens):** "iers", "pl", "level", "wrench", "hammer", "_PAUSE_", "...", "Tools", "plum", "banana", "peach", "orange", "...", "ruits", "F".
* **Y-axis Categories (Layers):** 0 to 11, inclusive.
### Detailed Analysis
The heatmap displays cosine similarity values as color intensities. The colorbar on the right indicates the mapping between color and similarity score.
* **Overall Trend:** The heatmap shows a complex pattern of similarity values. There isn't a single, dominant trend across all tokens and layers.
* **"iers" Token:** Similarity values are generally low, ranging from approximately -0.02 to 0.02 across layers 0-11. The color is predominantly green/purple.
* **"pl" Token:** Similarity values are low, ranging from approximately -0.02 to 0.02 across layers 0-11. The color is predominantly green/purple.
* **"level" Token:** Similarity values are low, ranging from approximately -0.02 to 0.02 across layers 0-11. The color is predominantly green/purple.
* **"wrench" Token:** Similarity values are low, ranging from approximately -0.02 to 0.02 across layers 0-11. The color is predominantly green/purple.
* **"hammer" Token:** Similarity values are low, ranging from approximately -0.02 to 0.02 across layers 0-11. The color is predominantly green/purple.
* **"_PAUSE_" Token:** Shows a distinct pattern. Layers 0-3 exhibit a strong negative correlation (purple, approximately -0.04). Layers 4-7 show a transition to neutral (green, around 0.00). Layers 8-11 show a slight positive correlation (yellow, around 0.02).
* **"Tools" Token:** Similarity values are low, ranging from approximately -0.02 to 0.02 across layers 0-11. The color is predominantly green/purple.
* **"plum" Token:** Similarity values are low, ranging from approximately -0.02 to 0.02 across layers 0-11. The color is predominantly green/purple.
* **"banana" Token:** Similarity values are low, ranging from approximately -0.02 to 0.02 across layers 0-11. The color is predominantly green/purple.
* **"peach" Token:** Similarity values are low, ranging from approximately -0.02 to 0.02 across layers 0-11. The color is predominantly green/purple.
* **"orange" Token:** Similarity values are low, ranging from approximately -0.02 to 0.02 across layers 0-11. The color is predominantly green/purple.
* **"ruits" Token:** Similarity values are low, ranging from approximately -0.02 to 0.02 across layers 0-11. The color is predominantly green/purple.
* **"F" Token:** Similarity values are low, ranging from approximately -0.02 to 0.02 across layers 0-11. The color is predominantly green/purple.
### Key Observations
* The "_PAUSE_" token exhibits the most noticeable variation in cosine similarity across layers, suggesting a dynamic relationship with Meta Token #2.
* Most tokens show relatively low and stable cosine similarity values across layers.
* The heatmap is largely dominated by green and purple hues, indicating predominantly low or negative cosine similarity.
### Interpretation
This heatmap likely represents the contextual relationship between Meta Token #2 and preceding tokens within a neural network or language model. Cosine similarity measures the angle between two vectors, indicating how similar their directions are. A value of 0 indicates orthogonality (no similarity), positive values indicate similarity, and negative values indicate dissimilarity.
The varying similarity scores across layers for the "_PAUSE_" token suggest that the model's understanding of the pause changes as information propagates through the network. The low similarity scores for most other tokens indicate that they are relatively less relevant to Meta Token #2, or that their representations are orthogonal to it. The "padding" in the title suggests that the tokens are part of a sequence that has been padded to a fixed length, which could influence the similarity scores. The heatmap provides insights into how the model processes and relates different tokens within a sequence, potentially revealing important aspects of its internal representation.