## Histogram: Residual Norms Comparison
### Overview
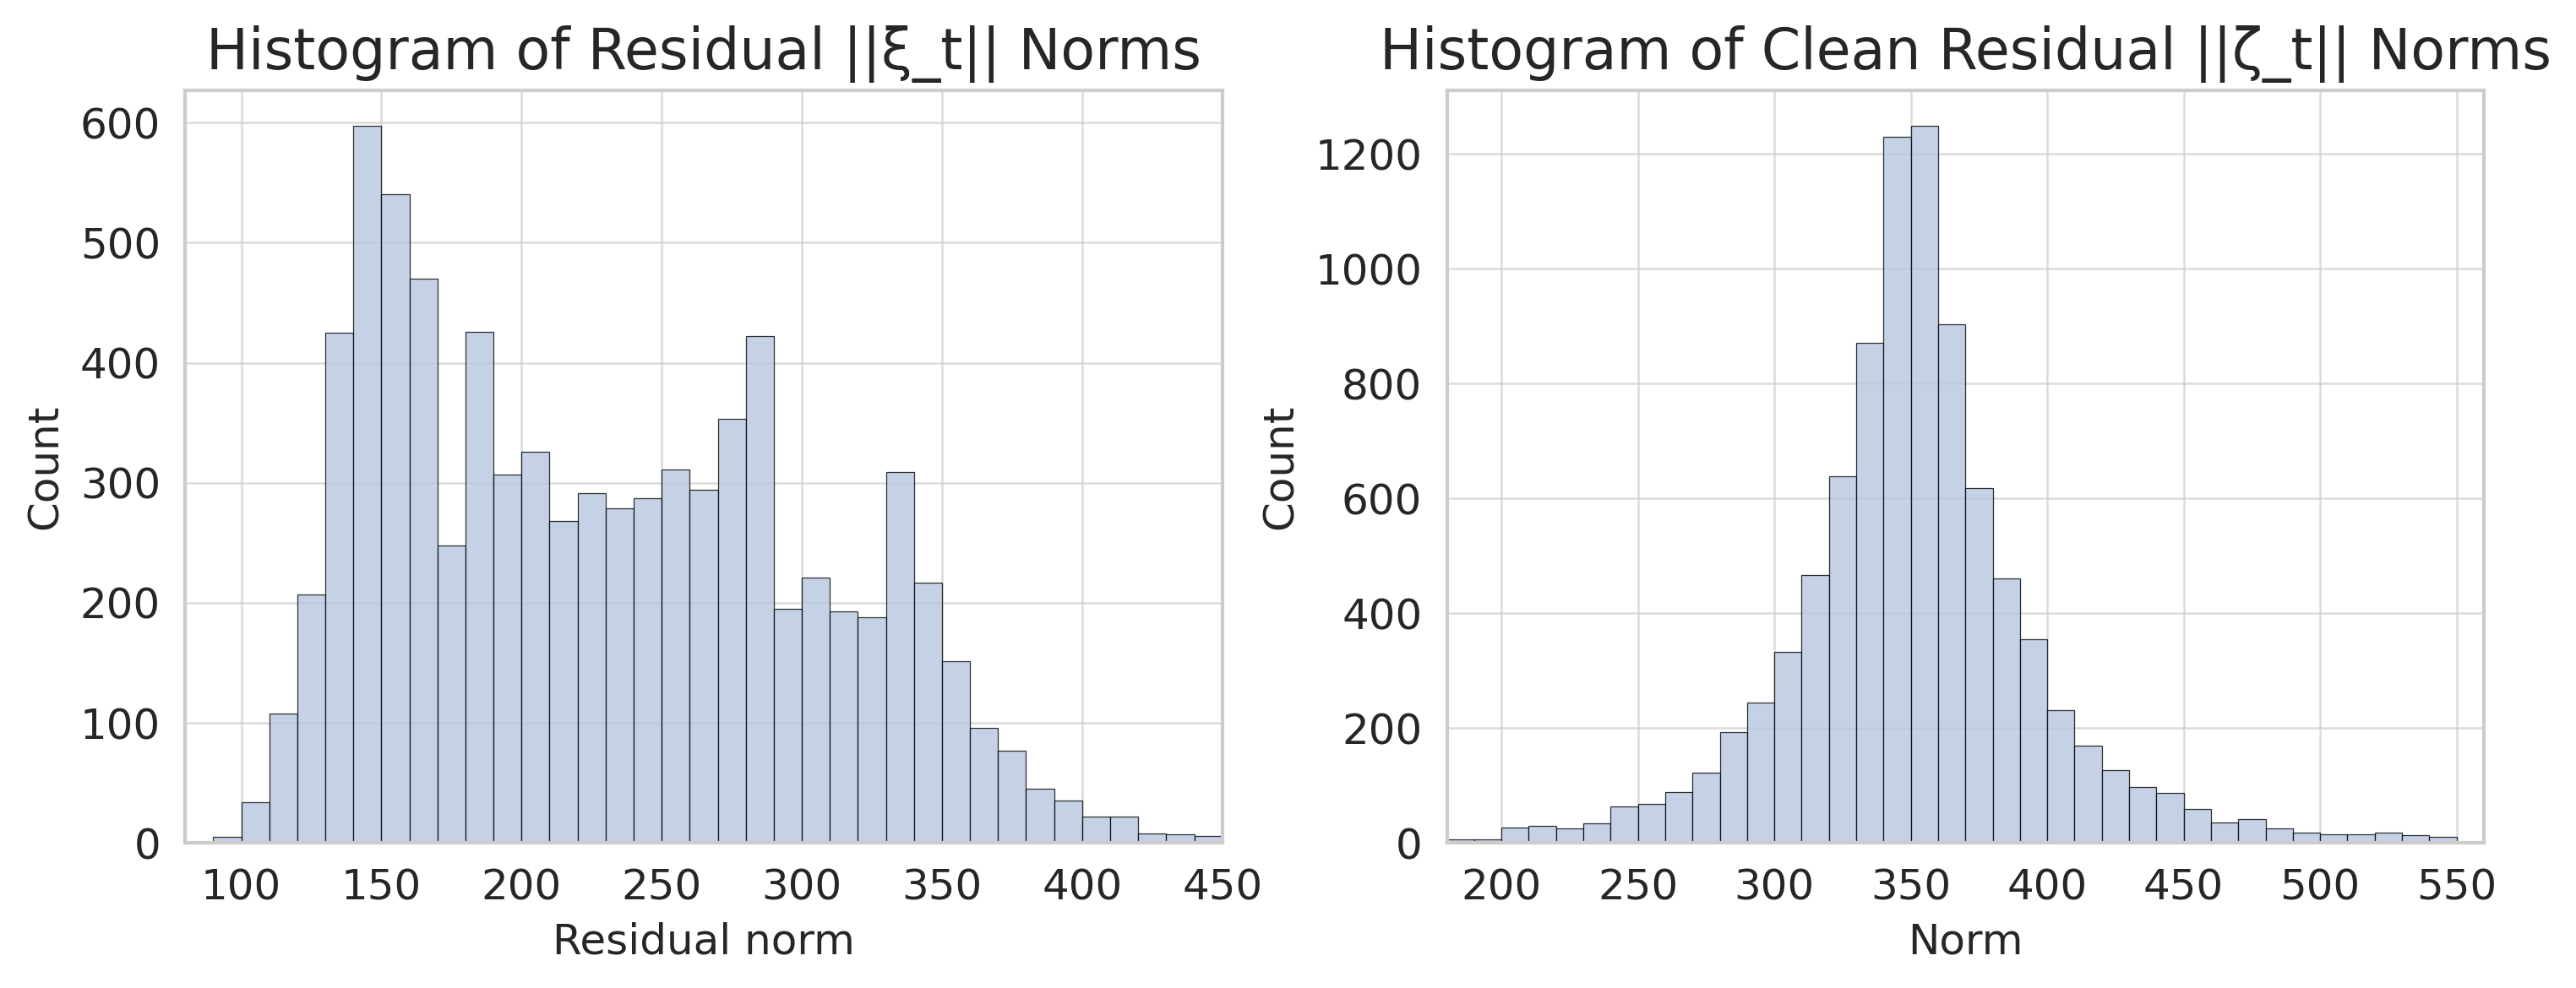
The image presents two histograms side-by-side. The left histogram displays the distribution of residual norms denoted as ||ξ_t||, while the right histogram shows the distribution of clean residual norms denoted as ||ζ_t||. Both histograms use the same color scheme for their bars (light blue with dark blue outlines) and share a similar visual style.
### Components/Axes
**Left Histogram:**
* **Title:** Histogram of Residual ||ξ_t|| Norms
* **X-axis:** Residual norm, ranging from 100 to 450 in increments of approximately 50.
* **Y-axis:** Count, ranging from 0 to 600 in increments of 100.
**Right Histogram:**
* **Title:** Histogram of Clean Residual ||ζ_t|| Norms
* **X-axis:** Norm, ranging from 200 to 550 in increments of approximately 50.
* **Y-axis:** Count, ranging from 0 to 1200 in increments of 200.
### Detailed Analysis
**Left Histogram (Residual ||ξ_t|| Norms):**
* The distribution is multi-modal, with peaks around 150, 200, 300, and 350.
* The highest count is observed around the 150 mark, with a value of approximately 600.
* The count decreases as the residual norm increases beyond 350, approaching 0 near 450.
* Specific data points (approximate):
* 100: ~20
* 150: ~600
* 200: ~420
* 250: ~300
* 300: ~420
* 350: ~300
* 400: ~50
* 450: ~10
**Right Histogram (Clean Residual ||ζ_t|| Norms):**
* The distribution is unimodal, with a single peak.
* The peak is located around the 350 mark, with a count of approximately 1250.
* The count increases sharply from 200 to 350 and then decreases gradually towards 550.
* Specific data points (approximate):
* 200: ~10
* 250: ~50
* 300: ~250
* 350: ~1250
* 400: ~800
* 450: ~200
* 500: ~50
* 550: ~10
### Key Observations
* The distribution of clean residual norms (||ζ_t||) is much more concentrated around a single value (350) compared to the residual norms (||ξ_t||), which are spread across multiple peaks.
* The maximum count for clean residual norms is significantly higher (1250) than that for residual norms (600).
* The range of residual norms (100-450) is slightly different from the range of clean residual norms (200-550).
### Interpretation
The histograms suggest that the "clean residual" process results in a more focused distribution of norms, centered around a value of 350. This indicates that the cleaning process effectively reduces the variability in the residual norms, leading to a more predictable and concentrated distribution. The multi-modal distribution of the original residual norms (||ξ_t||) suggests that there may be multiple underlying factors or sources contributing to the residuals before the cleaning process is applied. The shift in the distribution and the increase in the peak count after cleaning indicate a significant change in the characteristics of the residuals.