## Histograms: Residual Norms Comparison
### Overview
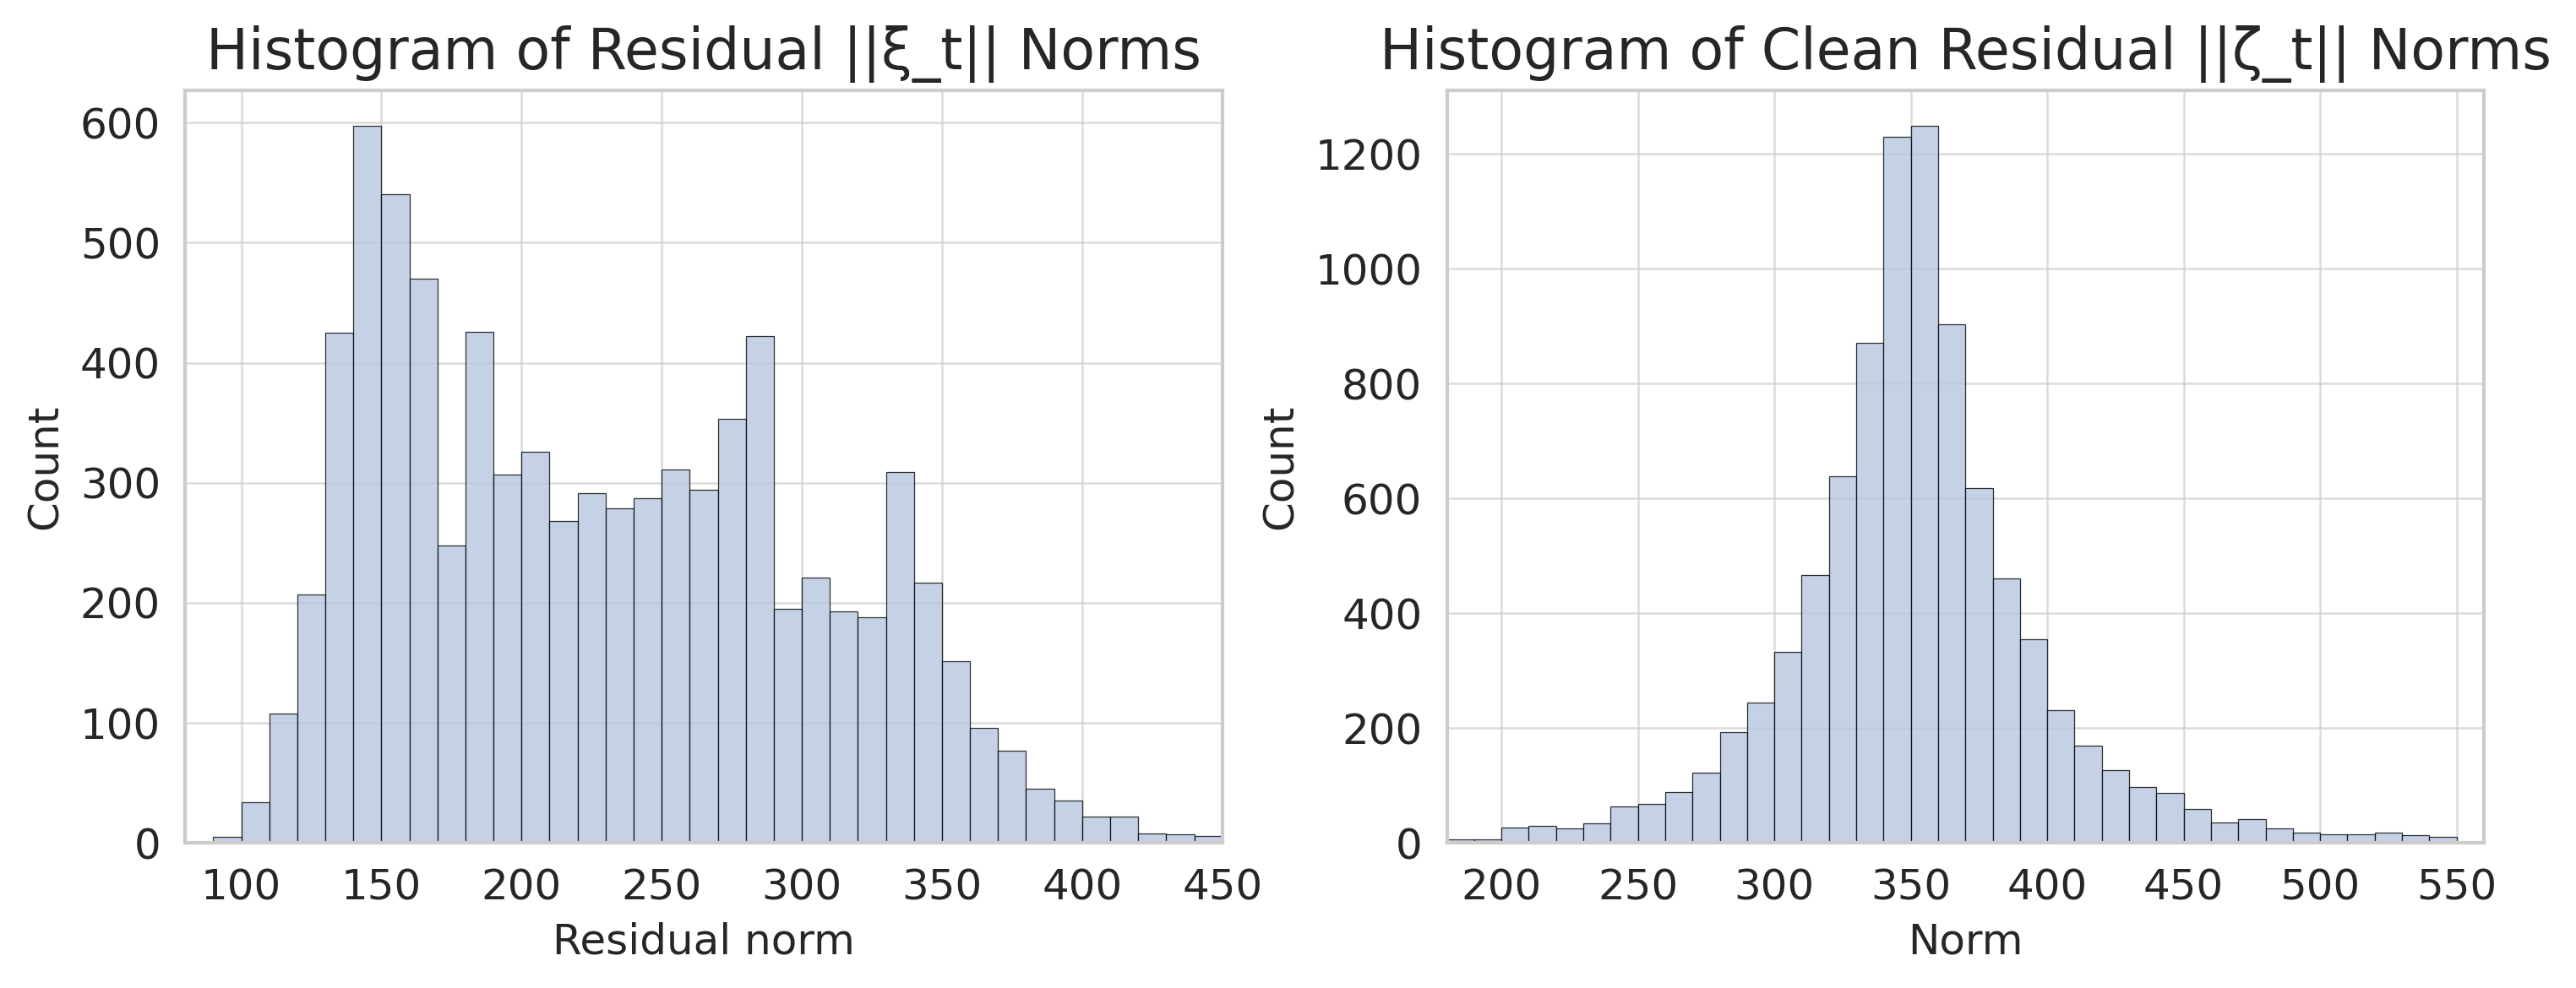
The image presents two histograms side-by-side, comparing the distribution of residual norms. The left histogram displays "Residual ||ζ_t|| Norms", while the right histogram shows "Clean Residual ||ζ_t|| Norms". Both histograms use the same vertical axis scale (Count) but differ in their horizontal axis scales (Residual norm and Norm respectively) and distributions.
### Components/Axes
Both histograms share the following components:
* **Title:** Positioned at the top-center of each chart.
* **X-axis Label:** Located at the bottom of each chart, indicating the measured value.
* **Y-axis Label:** Positioned on the left side of each chart, labeled "Count".
* **Gridlines:** A light gray grid is present in the background of both charts.
* **Bars:** Represent the frequency of values within specific bins.
Specifics for each histogram:
* **Left Histogram:**
* **Title:** "Histogram of Residual ||ζ_t|| Norms"
* **X-axis Label:** "Residual norm"
* **X-axis Range:** Approximately 100 to 450.
* **Y-axis Range:** Approximately 0 to 600.
* **Right Histogram:**
* **Title:** "Histogram of Clean Residual ||ζ_t|| Norms"
* **X-axis Label:** "Norm"
* **X-axis Range:** Approximately 200 to 550.
* **Y-axis Range:** Approximately 0 to 1200.
### Detailed Analysis or Content Details
**Left Histogram (Residual ||ζ_t|| Norms):**
The distribution is roughly unimodal, with a peak around 150-170. The histogram shows a significant drop in count between approximately 170 and 220, followed by a secondary peak around 280-300. The distribution appears to be skewed slightly to the right.
* Approximate counts:
* At Residual norm = 120: Count ≈ 20
* At Residual norm = 150: Count ≈ 420
* At Residual norm = 170: Count ≈ 550
* At Residual norm = 220: Count ≈ 100
* At Residual norm = 280: Count ≈ 250
* At Residual norm = 350: Count ≈ 180
* At Residual norm = 420: Count ≈ 50
**Right Histogram (Clean Residual ||ζ_t|| Norms):**
The distribution is also roughly unimodal, but with a more pronounced peak around 350-370. The distribution is more symmetrical than the left histogram.
* Approximate counts:
* At Norm = 220: Count ≈ 20
* At Norm = 300: Count ≈ 200
* At Norm = 350: Count ≈ 1100
* At Norm = 370: Count ≈ 1200
* At Norm = 400: Count ≈ 600
* At Norm = 450: Count ≈ 200
* At Norm = 500: Count ≈ 50
### Key Observations
* The "Clean Residual" norms (right histogram) generally have higher values than the "Residual" norms (left histogram).
* The "Clean Residual" distribution is more concentrated around a higher norm value (around 350-370) compared to the "Residual" distribution (peak around 150-170).
* The left histogram exhibits a more complex shape with a noticeable dip and secondary peak, suggesting a more varied distribution of residual norms before cleaning.
* The right histogram is more symmetrical and has a sharper peak, indicating a more consistent distribution of residual norms after cleaning.
### Interpretation
These histograms likely represent the norms of residual vectors (||ζ_t||) before and after a "cleaning" process. The cleaning process appears to have shifted the distribution of residual norms to higher values and reduced the variability, resulting in a more concentrated and symmetrical distribution. This suggests that the cleaning process effectively reduced the magnitude of some residual vectors, potentially by removing outliers or correcting errors. The dip in the left histogram could indicate the removal of a specific range of residual norms during the cleaning process. The higher concentration of values in the right histogram suggests that the cleaning process has made the residuals more consistent and potentially more reliable. The data suggests the cleaning process is effective in reducing the magnitude of the residuals.