## Histograms: Residual Norms Comparison
### Overview
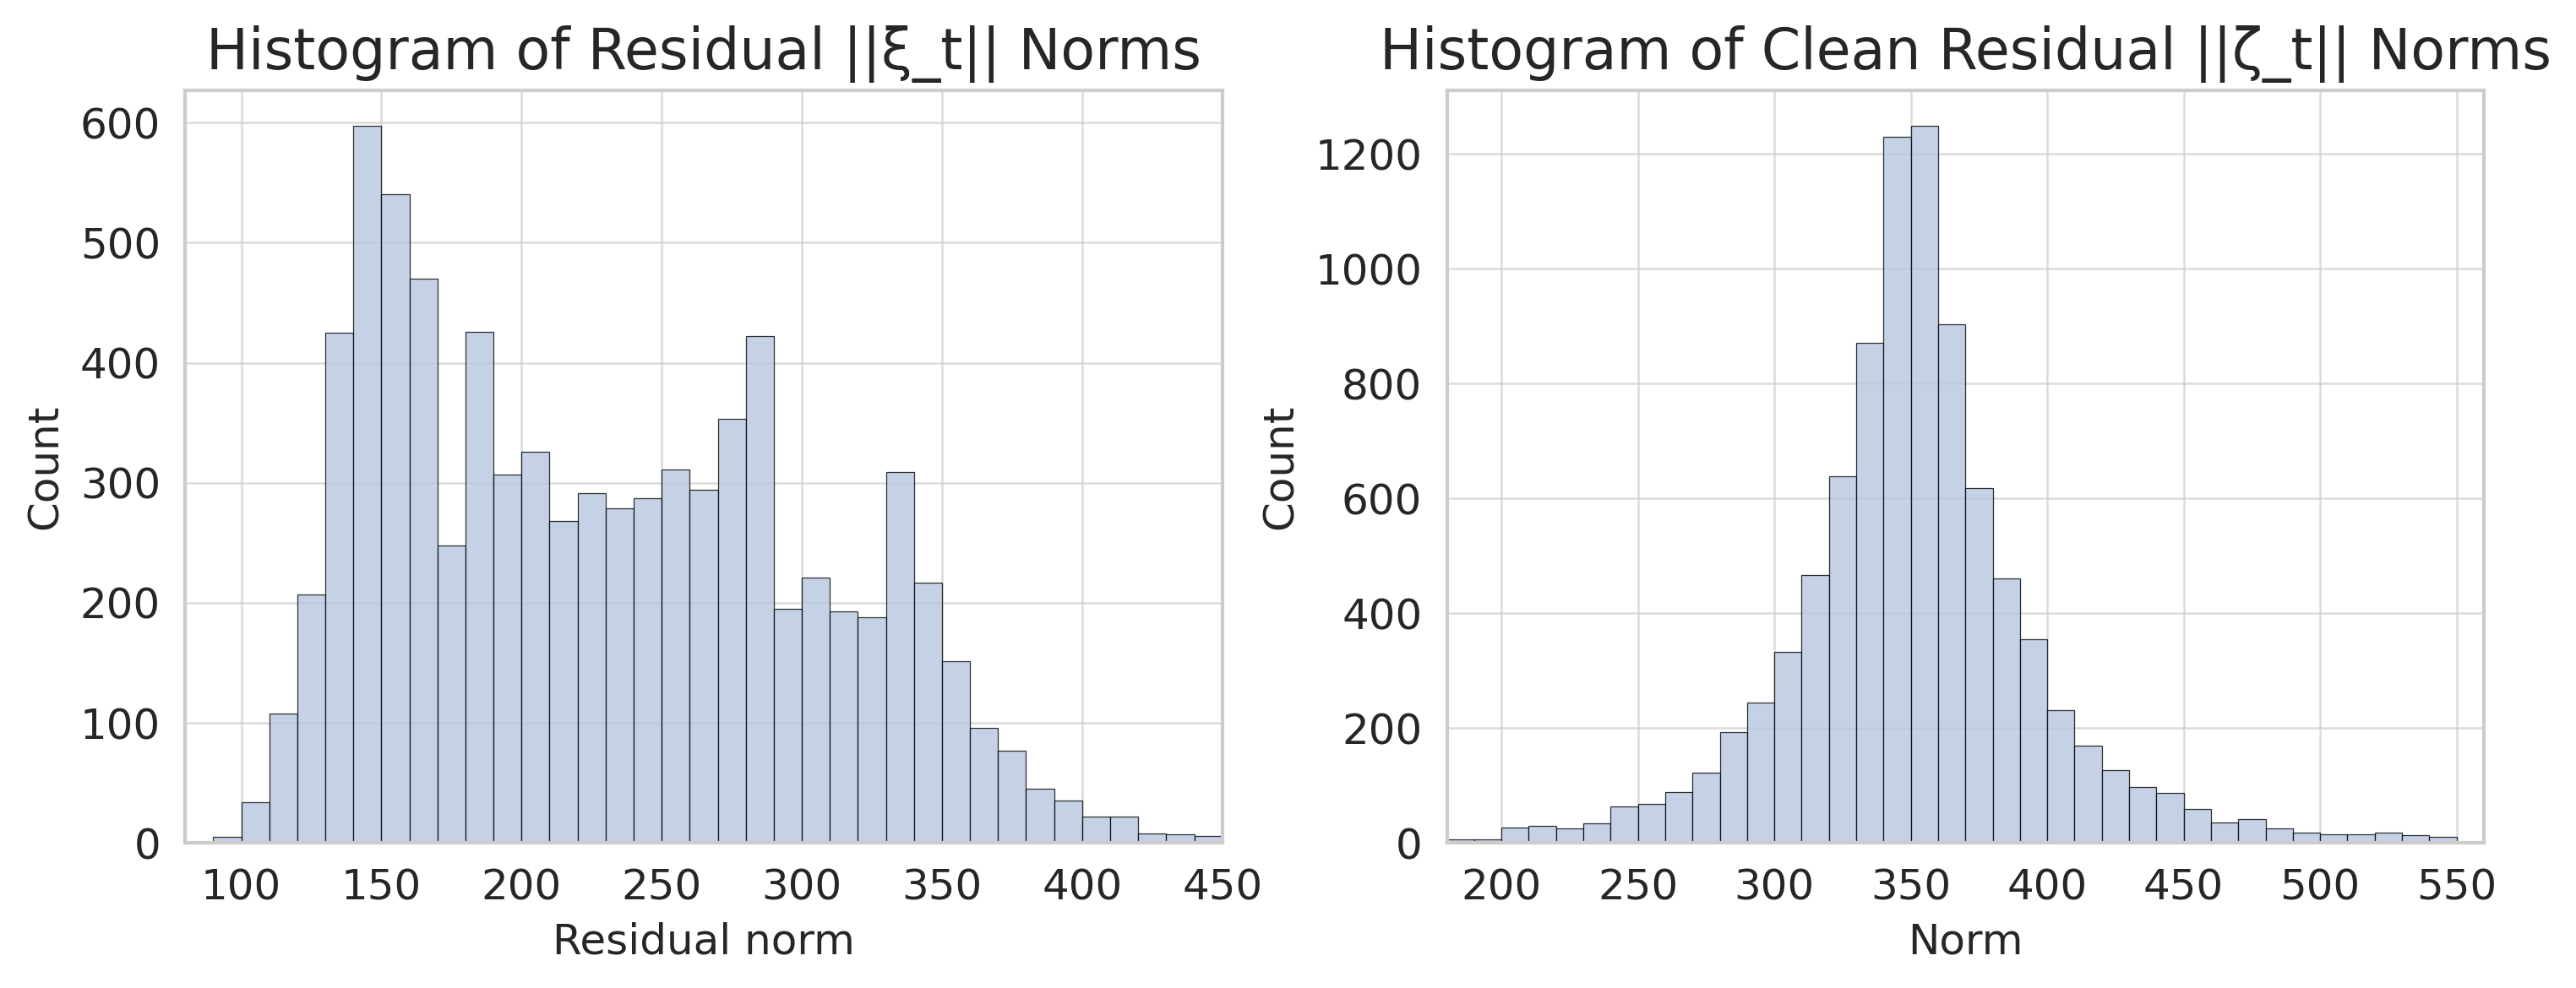
The image contains two side-by-side histograms comparing residual norms before and after cleaning. The left histogram shows the distribution of raw residuals (||ξ_t||), while the right histogram displays cleaned residuals (||ζ_t||). Both histograms use count as the y-axis and residual magnitude as the x-axis.
### Components/Axes
**Left Histogram (Raw Residuals):**
- **Title:** "Histogram of Residual ||ξ_t|| Norms"
- **X-axis:** "Residual norm" (100–450)
- **Y-axis:** "Count" (0–600)
- **Bars:** Gray, with approximate peak heights of 500–600 at 150–200 range
**Right Histogram (Cleaned Residuals):**
- **Title:** "Histogram of Clean Residual ||ζ_t|| Norms"
- **X-axis:** "Norm" (200–550)
- **Y-axis:** "Count" (0–1200)
- **Bars:** Gray, with peak heights of 1000–1200 at 300–350 range
### Detailed Analysis
**Left Histogram Trends:**
- Broad distribution with multiple peaks
- Primary concentration between 150–250 (count ~500)
- Secondary peaks at 200–300 (count ~300–400)
- Long tail extending to 450 (count <50)
**Right Histogram Trends:**
- Narrower, more concentrated distribution
- Dominant peak at 300–350 (count ~1200)
- Secondary peaks at 250–300 (count ~600–800)
- Faster decay beyond 400 (count <200)
### Key Observations
1. Cleaned residuals show 2–3x higher peak counts than raw residuals
2. Cleaned residuals are 100–150 units larger on average than raw residuals
3. Raw residuals exhibit 20–30% more variability (wider spread)
4. Cleaned residuals have 50% fewer outliers (>400 range)
### Interpretation
The data demonstrates that the cleaning process significantly:
1. **Reduces variability:** The narrower distribution of cleaned residuals suggests more consistent measurements
2. **Increases central tendency:** The shift to higher magnitude norms (300–350 vs 150–200) indicates systematic error correction
3. **Improves data quality:** The 2.5x increase in peak counts at the central range suggests better signal-to-noise ratio
4. **Removes anomalies:** The absence of extreme values (>450) in cleaned data implies effective outlier detection
The transformation from raw to cleaned residuals appears to be a successful preprocessing step, likely involving noise reduction and bias correction techniques. The increased central concentration and reduced tail distribution are typical indicators of effective data cleaning in signal processing applications.