\n
## Line Chart: Latency per Token vs. Number of Tokens
### Overview
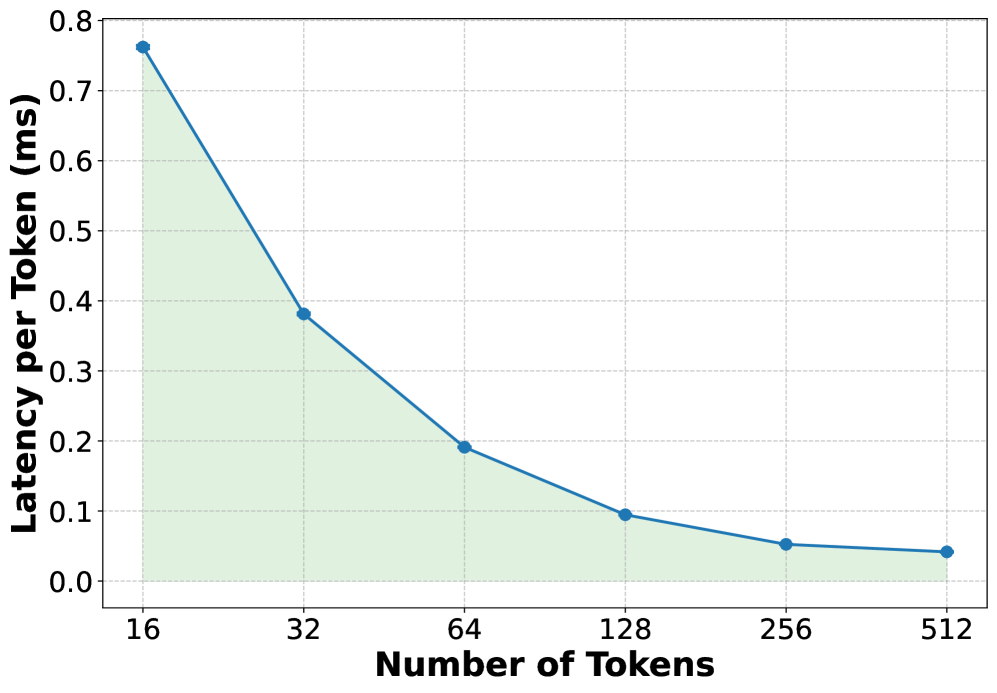
This image presents a line chart illustrating the relationship between the number of tokens and the latency per token. The chart shows a decreasing trend, indicating that as the number of tokens increases, the latency per token decreases.
### Components/Axes
* **X-axis:** Number of Tokens. Scale ranges from 16 to 512, with markers at 16, 32, 64, 128, 256, and 512.
* **Y-axis:** Latency per Token (ms). Scale ranges from 0 to 0.8, with markers at 0, 0.1, 0.2, 0.3, 0.4, 0.5, 0.6, 0.7, and 0.8.
* **Data Series:** A single teal-colored line representing the latency per token.
* **Background:** A light green grid.
### Detailed Analysis
The teal line begins at approximately (16, 0.76 ms) and exhibits a steep downward slope initially.
Here's a breakdown of approximate data points:
* (16, 0.76 ms)
* (32, 0.38 ms)
* (64, 0.19 ms)
* (128, 0.08 ms)
* (256, 0.05 ms)
* (512, 0.03 ms)
The line's slope decreases as the number of tokens increases, indicating diminishing returns in latency reduction. The line flattens out between 256 and 512 tokens, suggesting that increasing the number of tokens beyond 256 yields minimal further reduction in latency per token.
### Key Observations
* The most significant latency reduction occurs between 16 and 64 tokens.
* The curve demonstrates a logarithmic-like decay.
* The latency per token approaches zero as the number of tokens increases, but never quite reaches it within the displayed range.
### Interpretation
The chart suggests that processing latency per token is highly sensitive to the number of tokens, especially at lower token counts. This could be due to overhead associated with initializing or setting up processing for each token. As the number of tokens increases, the overhead becomes less significant relative to the total processing time, leading to a decrease in latency per token. The flattening of the curve at higher token counts indicates that there's a limit to how much latency can be reduced by simply increasing the number of tokens. This could be due to inherent limitations in the processing hardware or software. The data suggests an optimal range for token count exists, where latency is minimized without significant diminishing returns. This information is valuable for optimizing systems that process tokenized data, such as large language models or text processing pipelines.