## Line Graph: Latency per Token vs. Number of Tokens
### Overview
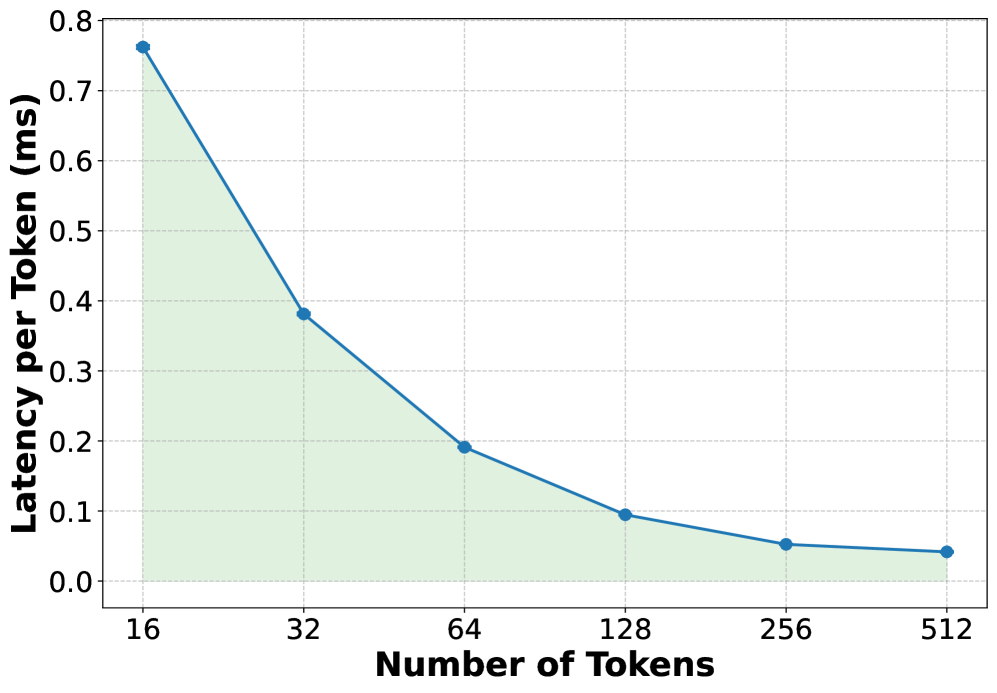
The image depicts a line graph illustrating the relationship between the number of tokens processed and the latency per token (in milliseconds). The graph shows a decreasing trend in latency as the number of tokens increases, with a shaded green area under the line.
### Components/Axes
- **X-axis (Horizontal)**: Labeled "Number of Tokens" with discrete values: 16, 32, 64, 128, 256, 512.
- **Y-axis (Vertical)**: Labeled "Latency per Token (ms)" with a scale from 0.0 to 0.8.
- **Legend**: No explicit legend is present, but the line is blue, and the shaded area is green.
- **Data Points**: Blue circular markers connected by a solid blue line.
### Detailed Analysis
- **Data Points**:
- At 16 tokens: ~0.76 ms
- At 32 tokens: ~0.38 ms
- At 64 tokens: ~0.19 ms
- At 128 tokens: ~0.10 ms
- At 256 tokens: ~0.05 ms
- At 512 tokens: ~0.04 ms
- **Trend**: The latency per token decreases exponentially as the number of tokens increases. The decline is steepest between 16 and 32 tokens, then gradually flattens.
- **Shaded Area**: A green triangular region under the line, suggesting cumulative latency or a weighted average of latency across token counts.
### Key Observations
1. **Exponential Decay**: Latency per token drops significantly with increasing token counts, indicating improved efficiency at scale.
2. **Diminishing Returns**: The rate of latency reduction slows after 64 tokens, suggesting a plateau in performance gains.
3. **Shaded Area**: The green region implies that total latency (e.g., cumulative or integrated) decreases as more tokens are processed, though the exact metric is ambiguous without additional context.
### Interpretation
The graph demonstrates that processing larger batches of tokens reduces the average latency per token, likely due to optimized parallel processing or algorithmic efficiency. The shaded area may represent the total latency over the token range, highlighting that larger token counts minimize overall computational overhead. This trend is critical for applications requiring high-throughput token processing, such as natural language processing or real-time data analysis. The flattening curve at higher token counts suggests a limit to scalability, possibly due to hardware constraints or algorithmic bottlenecks.