\n
## Scatter Plots: Projection of activations on τG and τP
### Overview
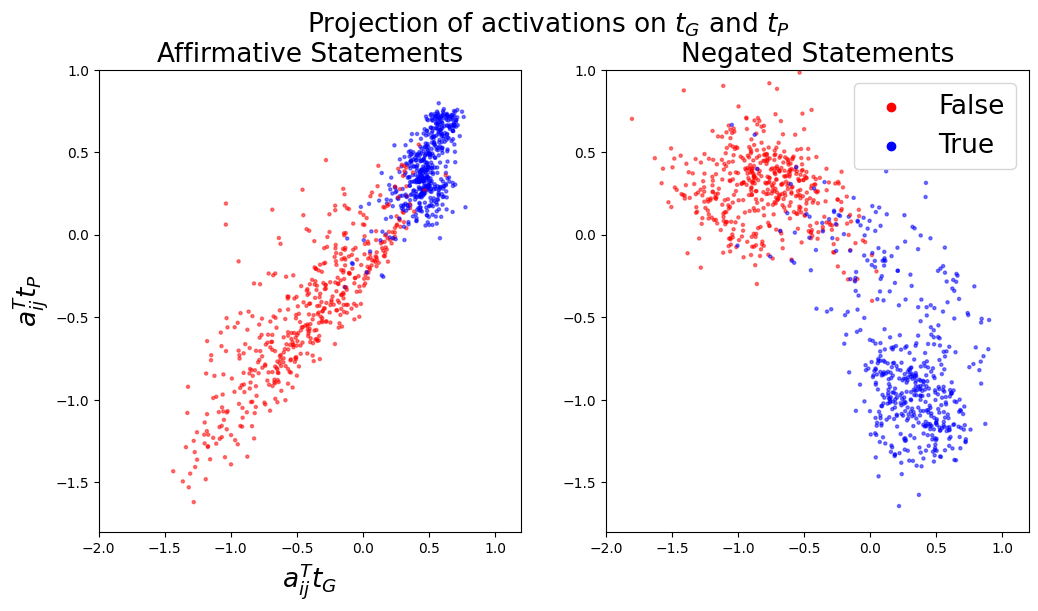
The image presents two scatter plots, side-by-side, visualizing the projection of activations onto parameters τG and τP. The left plot displays data for "Affirmative Statements," while the right plot shows data for "Negated Statements." Each plot uses color to differentiate between "True" and "False" classifications.
### Components/Axes
Both plots share the following characteristics:
* **X-axis Label:** a<sub>ij</sub><sup>τG</sup>, ranging approximately from -2.0 to 1.0.
* **Y-axis Label:** a<sub>ij</sub><sup>τP</sup>, ranging approximately from -1.5 to 1.0.
* **Title (Left Plot):** "Affirmative Statements"
* **Title (Right Plot):** "Negated Statements"
* **Legend (Top-Right of Right Plot):**
* Red circles: "False"
* Blue circles: "True"
### Detailed Analysis or Content Details
**Left Plot: Affirmative Statements**
* **True (Blue):** The blue points form a diagonal band, sloping upwards from approximately (-1.5, -1.5) to (0.8, 0.8). The density of points is higher around the center of the band.
* **False (Red):** The red points are scattered below the blue band, forming a more diffuse cloud. They extend from approximately (-1.8, -1.5) to (0.5, -0.5).
* There is a clear separation between the blue and red points, though some overlap exists.
**Right Plot: Negated Statements**
* **True (Blue):** The blue points form a diagonal band, sloping downwards from approximately (-0.8, 0.8) to (0.8, -0.8). The density of points is higher around the center of the band.
* **False (Red):** The red points are scattered above the blue band, forming a more diffuse cloud. They extend from approximately (-1.5, 1.0) to (0.5, 0.5).
* There is a clear separation between the blue and red points, though some overlap exists.
### Key Observations
* The "True" and "False" classifications exhibit distinct patterns in both plots.
* The diagonal orientation of the "True" clusters differs between the "Affirmative" and "Negated" statements. The "Affirmative" statements have a positive slope, while the "Negated" statements have a negative slope.
* The "False" classifications appear more scattered and less concentrated than the "True" classifications in both plots.
* The scales of both axes are identical across both plots.
### Interpretation
The plots suggest that the projection of activations onto τG and τP can effectively differentiate between "True" and "False" statements, both in their affirmative and negated forms. The differing slopes of the "True" clusters indicate that the representation of affirmative and negated statements is distinct in this activation space. The more diffuse distribution of "False" statements might indicate that these statements are less consistently represented or require more complex activation patterns.
The use of τG and τP as projection parameters suggests these parameters are relevant to the underlying logic or reasoning process being modeled. The separation between "True" and "False" indicates that these parameters capture information that is predictive of statement validity. The differing patterns for affirmative and negated statements suggest that the model handles negation in a meaningful way, rather than simply treating negated statements as equivalent to their positive counterparts.
The plots provide a visual representation of how the model encodes logical information, and could be used to further investigate the model's internal representations and reasoning mechanisms.