## Scatter Plots: Projection of activations on t_G and t_P
### Overview
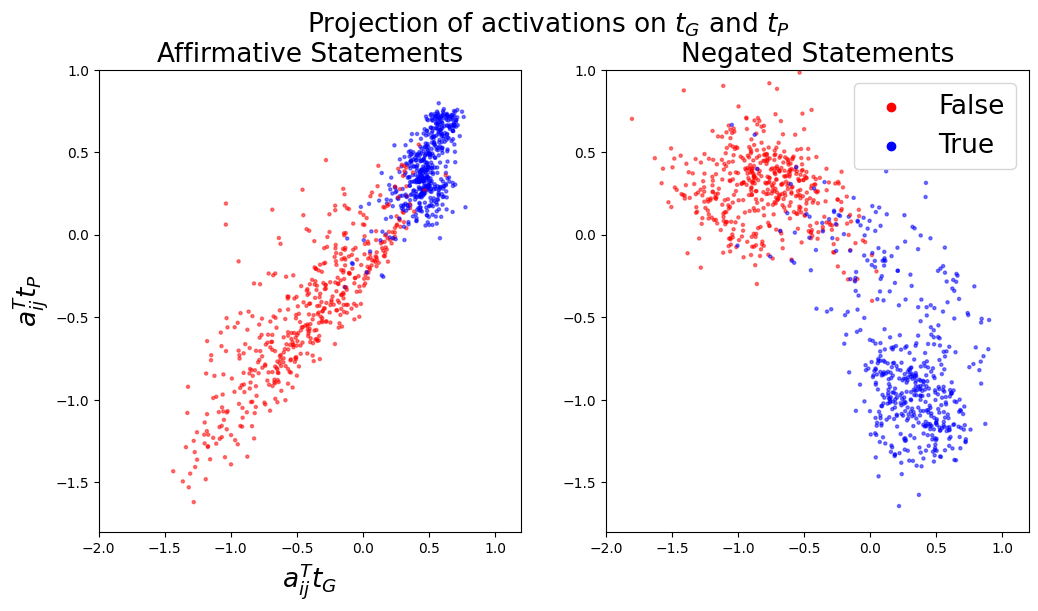
Two scatter plots are presented side-by-side, comparing the projection of activations on two variables: **t_G** (x-axis) and **t_P** (y-axis). The left plot represents **Affirmative Statements**, and the right plot represents **Negated Statements**. Data points are color-coded: **red** for "False" and **blue** for "True."
### Components/Axes
- **X-axis (a^T_j t_G)**: Ranges from -2.0 to 1.0.
- **Y-axis (a^T_j t_P)**: Ranges from -1.5 to 1.0.
- **Legend**: Located in the top-right corner of each plot.
- **Red**: False (negative class).
- **Blue**: True (positive class).
### Detailed Analysis
#### Affirmative Statements (Left Plot)
- **Red points (False)**:
- Distributed across the lower-left quadrant (x ≈ -1.5 to 0.5, y ≈ -1.5 to 0.5).
- Some outliers extend toward the upper-right quadrant.
- **Blue points (True)**:
- Clustered in the upper-right quadrant (x ≈ 0.0 to 1.0, y ≈ 0.0 to 1.0).
- Density decreases as x and y values decrease.
#### Negated Statements (Right Plot)
- **Red points (False)**:
- Concentrated in the upper-left quadrant (x ≈ -1.5 to 0.0, y ≈ 0.0 to 1.0).
- Sparse outliers extend toward the lower-right quadrant.
- **Blue points (True)**:
- Clustered in the lower-right quadrant (x ≈ 0.0 to 1.0, y ≈ -1.5 to 0.0).
- Density decreases as x and y values increase.
### Key Observations
1. **Affirmative Statements**:
- True statements (blue) are strongly associated with higher values of both **a^T_j t_G** and **a^T_j t_P**.
- False statements (red) show greater variability, with some overlapping regions between True and False.
2. **Negated Statements**:
- True statements (blue) are associated with lower values of **a^T_j t_P** but higher values of **a^T_j t_G**.
- False statements (red) dominate the upper-left quadrant, suggesting a distinct separation from True statements.
3. **General Trends**:
- In both plots, True statements form tighter clusters compared to False statements.
- The separation between True and False is more pronounced in **Negated Statements**.
### Interpretation
The plots suggest that the model distinguishes between True and False statements based on the interplay of **t_G** and **t_P** activations. For **Affirmative Statements**, True cases align with higher activation magnitudes in both variables, while False cases exhibit broader dispersion. In **Negated Statements**, True cases are characterized by lower **t_P** activations but higher **t_G** activations, indicating a potential inverse relationship in negation contexts. The tighter clustering of True statements implies that the model’s decision boundary is more defined for negated statements, whereas affirmative statements show more ambiguity, possibly due to overlapping activation patterns.
### Spatial Grounding
- **Legend**: Top-right corner of each plot.
- **Data Points**:
- Affirmative: Red (False) dominates lower-left; Blue (True) clusters upper-right.
- Negated: Red (False) dominates upper-left; Blue (True) clusters lower-right.
### Trend Verification
- **Affirmative**:
- Red points slope diagonally from lower-left to upper-right (negative correlation).
- Blue points cluster in the upper-right (positive correlation).
- **Negated**:
- Red points slope diagonally from upper-left to lower-right (negative correlation).
- Blue points cluster in the lower-right (positive correlation).
### Content Details
- No explicit numerical data table is present; values are inferred from axis ranges and point distributions.
- Axis labels and legend colors are consistent across both plots.
### Final Notes
The visualization highlights how activation projections differ between True and False statements, with distinct patterns emerging for affirmative vs. negated contexts. This could inform model interpretability or bias analysis in natural language processing tasks.