\n
## Bar Chart: F1 Score and BLEU-1 vs. k Values
### Overview
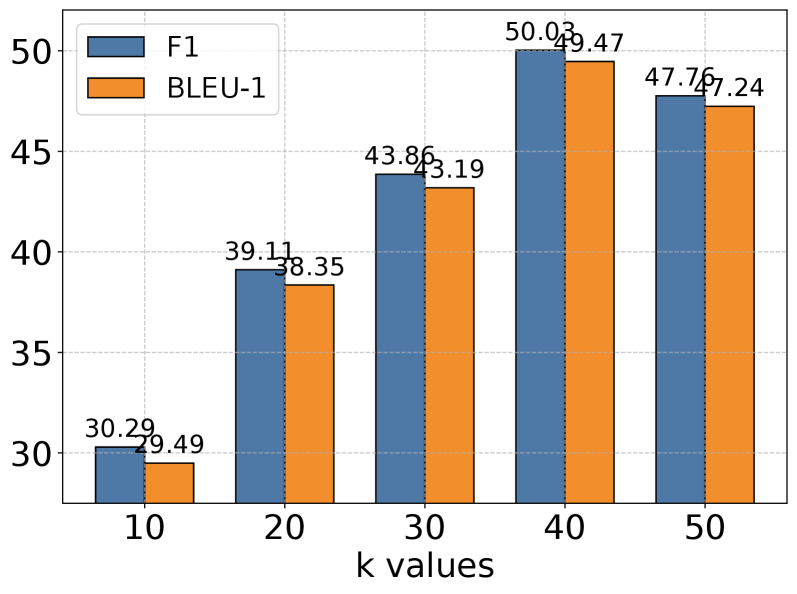
This bar chart compares the F1 score and BLEU-1 metric values for different 'k' values. The chart displays these metrics as bar heights for k values of 10, 20, 30, 40, and 50. The F1 score is represented by blue bars, and the BLEU-1 score is represented by orange bars.
### Components/Axes
* **X-axis:** "k values" with markers at 10, 20, 30, 40, and 50.
* **Y-axis:** Scale ranging from approximately 28 to 52, representing the metric values (F1 and BLEU-1).
* **Legend:** Located in the top-left corner.
* Blue bar: "F1"
* Orange bar: "BLEU-1"
### Detailed Analysis
The chart presents paired bar values for each k value.
* **k = 10:**
* F1: Approximately 30.29
* BLEU-1: Approximately 29.49
* **k = 20:**
* F1: Approximately 39.11
* BLEU-1: Approximately 38.35
* **k = 30:**
* F1: Approximately 43.86
* BLEU-1: Approximately 43.19
* **k = 40:**
* F1: Approximately 50.03
* BLEU-1: Approximately 49.47
* **k = 50:**
* F1: Approximately 47.76
* BLEU-1: Approximately 47.24
**Trends:**
* **F1 Score:** The F1 score generally increases from k=10 to k=40, then decreases slightly at k=50.
* **BLEU-1 Score:** The BLEU-1 score follows a similar trend to the F1 score, increasing from k=10 to k=40 and decreasing slightly at k=50.
* Both metrics show a strong positive correlation with increasing k values up to k=40.
### Key Observations
* The F1 score and BLEU-1 score are very close in value for each k value.
* The highest values for both metrics are achieved at k=40.
* There is a slight decrease in both metrics when k is increased from 40 to 50.
### Interpretation
The data suggests that increasing the 'k' value (likely representing a parameter in a model or algorithm, potentially related to the number of neighbors or candidates considered) generally improves both the F1 score and BLEU-1 score, indicating better performance up to a certain point. However, beyond k=40, increasing 'k' further leads to a slight performance degradation. This could indicate that beyond a certain level of consideration (k=40), adding more candidates or neighbors introduces noise or irrelevant information that negatively impacts the model's ability to accurately predict or generate results. The close proximity of the F1 and BLEU-1 values suggests a consistent relationship between precision/recall (F1) and the similarity to reference translations (BLEU-1) as 'k' changes. The chart demonstrates a trade-off between model complexity (represented by 'k') and performance, highlighting the importance of finding an optimal 'k' value for maximizing performance.