# Technical Document Extraction: Bar Chart Analysis
## 1. Chart Type and Overview
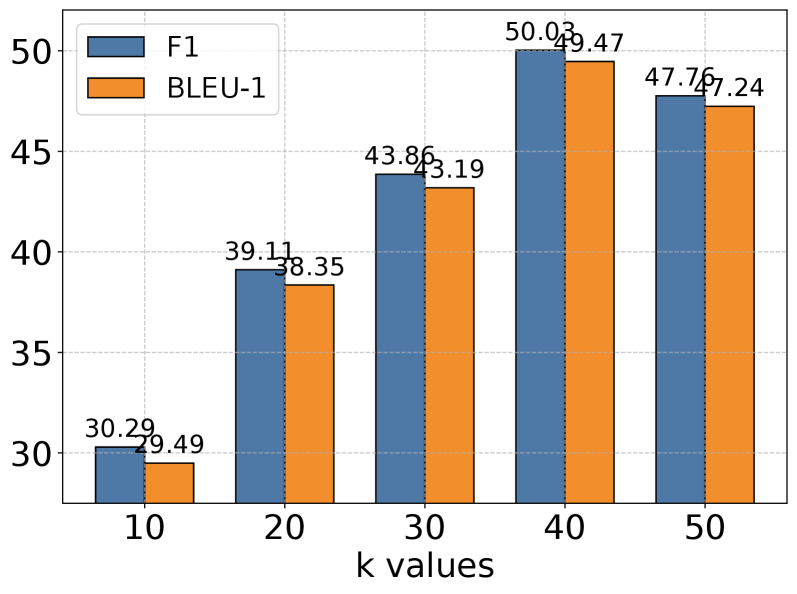
- **Chart Type**: Grouped bar chart comparing two metrics across discrete categories.
- **Primary Purpose**: Visual comparison of F1 and BLEU-1 scores across varying k values.
## 2. Axis Labels and Markers
- **X-Axis**:
- Title: "k values"
- Categories: 10, 20, 30, 40, 50 (discrete intervals)
- Scale: Linear, no intermediate markers
- **Y-Axis**:
- Title: Implicit (numeric scale)
- Range: 30 to 50
- Increment: 5 units (30, 35, 40, 45, 50)
## 3. Legend
- **Placement**: Top-left corner
- **Entries**:
- **F1**: Blue bars (solid fill)
- **BLEU-1**: Orange bars (solid fill)
- **Color Consistency Check**:
- All blue bars correspond to F1 values.
- All orange bars correspond to BLEU-1 values.
## 4. Data Points and Trends
### F1 Series (Blue)
- **Trend**:
- Increases from 10 → 40 (30.29 → 50.03)
- Decreases at k=50 (47.76)
- **Values**:
- k=10: 30.29
- k=20: 39.11
- k=30: 43.86
- k=40: 50.03
- k=50: 47.76
### BLEU-1 Series (Orange)
- **Trend**:
- Increases from 10 → 40 (29.49 → 49.47)
- Decreases at k=50 (47.24)
- **Values**:
- k=10: 29.49
- k=20: 38.35
- k=30: 43.19
- k=40: 49.47
- k=50: 47.24
## 5. Spatial Grounding
- **Legend Coordinates**: [x=0, y=0] (top-left corner relative to chart)
- **Bar Alignment**:
- Each k value has two adjacent bars (F1 left, BLEU-1 right)
- Bar width: Uniform across all categories
## 6. Component Isolation
### Header
- No explicit header text; legend serves as primary identifier.
### Main Chart
- **Structure**:
- 5 category groups (k=10 to k=50)
- 2 bars per group (F1 and BLEU-1)
- **Visual Hierarchy**:
- Y-axis scale emphasizes differences between 30–50 range.
### Footer
- No footer elements present.
## 7. Cross-Reference Validation
- **Legend vs. Data**:
- All blue bars match F1 values (e.g., k=40: 50.03).
- All orange bars match BLEU-1 values (e.g., k=50: 47.24).
- **Trend Consistency**:
- F1 peaks at k=40, then declines.
- BLEU-1 follows identical pattern but remains slightly below F1.
## 8. Missing/Implicit Information
- No explicit units for y-axis (assumed unitless scores).
- No gridlines visible in the chart (only axis ticks).
## 9. Final Notes
- The chart highlights a trade-off between F1 and BLEU-1 scores as k increases, with both metrics peaking at k=40 before declining.
- F1 consistently outperforms BLEU-1 across all k values.