TECHNICAL ASSET FINGERPRINT
465d1e064a22b26c8a4d6c60
Click to view fullscreen
Press ESC or click to close
FOUND IN PAPERS
EXPERT: healer-alpha-free VERSION 1
RUNTIME: free/openrouter/healer-alpha
INTEL_VERIFIED
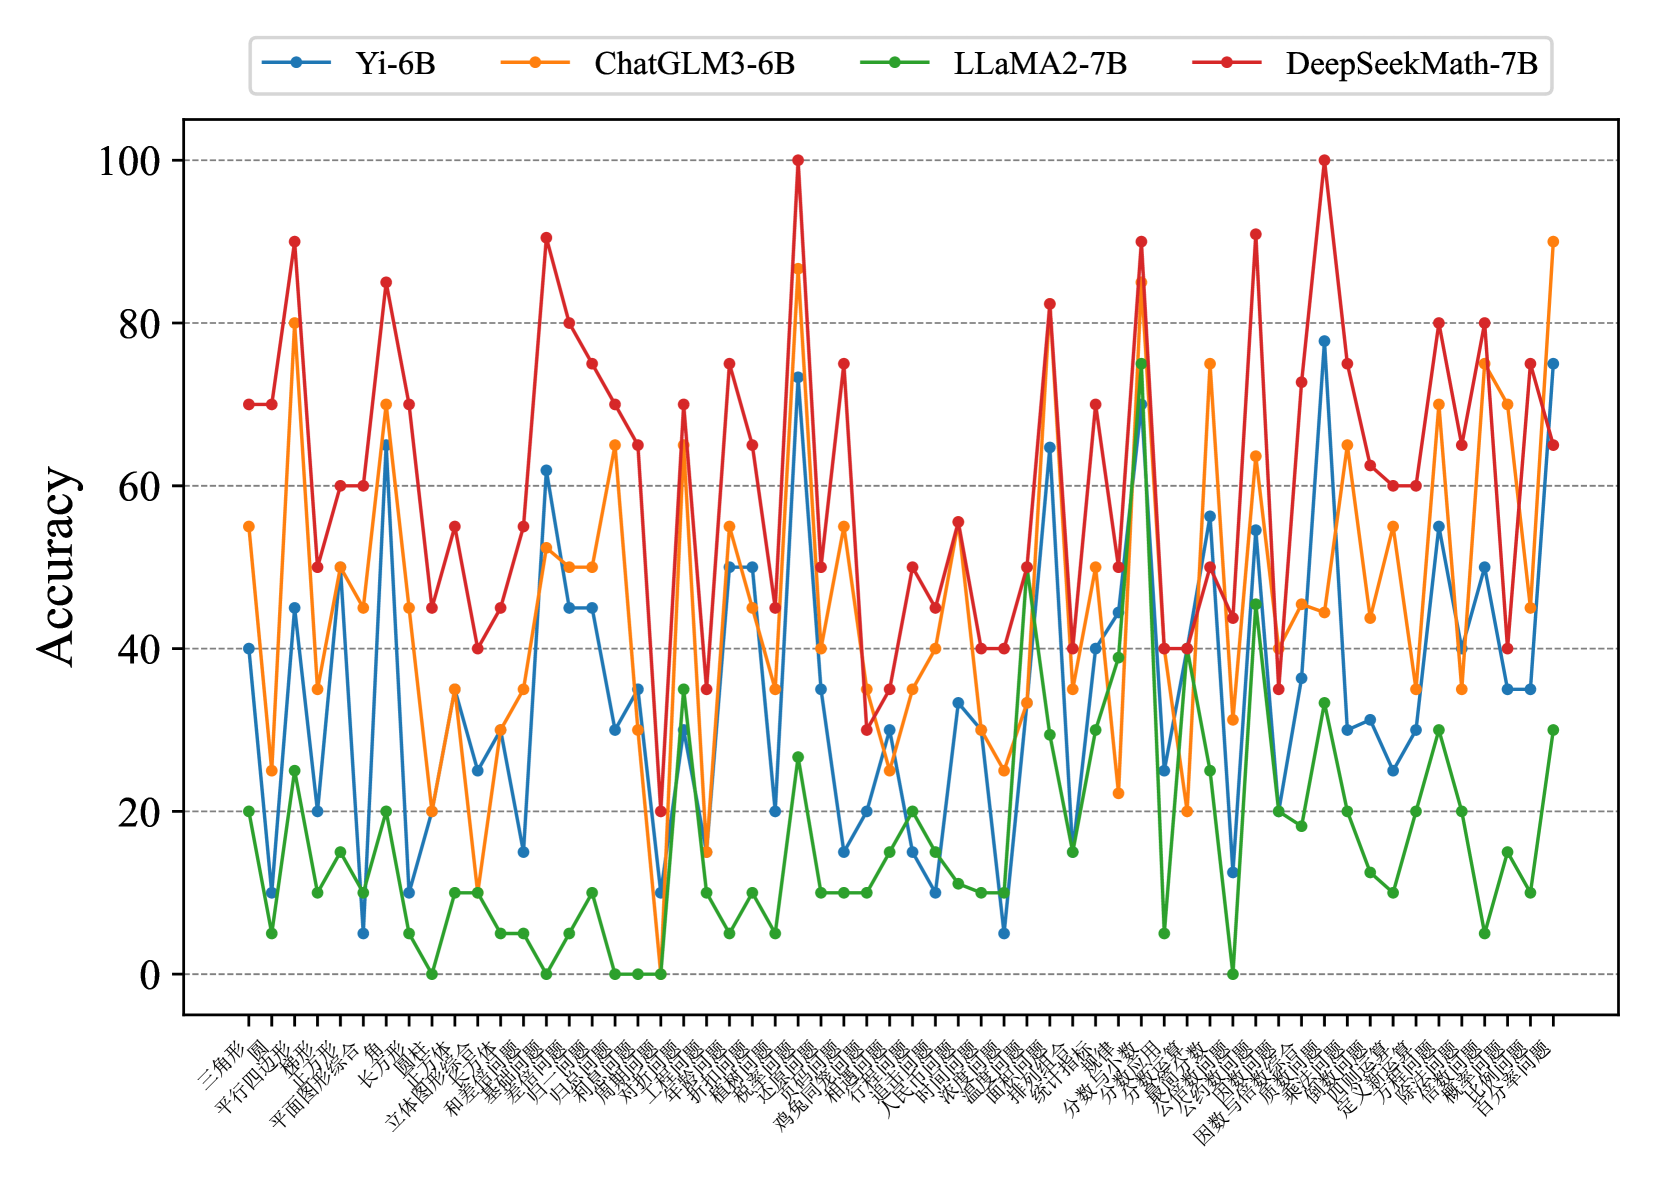
## Multi-Line Chart: Accuracy of Four Language Models Across Mathematical Problem Categories
### Overview
This image is a multi-line chart comparing the accuracy (0-100%) of four different large language models (LLMs) across a wide range of mathematical problem categories. The chart is dense, with each model's performance plotted as a distinct colored line connecting data points for each category. The overall visual impression is one of high variability, with significant performance differences between models and across categories.
### Components/Axes
* **Chart Type:** Multi-line chart with markers.
* **Y-Axis:**
* **Label:** "Accuracy"
* **Scale:** Linear, from 0 to 100.
* **Major Ticks/Gridlines:** At intervals of 20 (0, 20, 40, 60, 80, 100).
* **X-Axis:**
* **Label:** Not explicitly labeled, but contains a dense series of categorical problem types.
* **Categories (Transcribed from left to right):** 三角形, 圆, 平行四边形, 梯形, 平面图形综合, 长方形, 圆柱体, 立体图形综合, 和差问题, 和倍问题, 差倍问题, 归一问题, 归总问题, 周期问题, 盈亏问题, 年龄问题, 扩缩问题, 植树问题, 鸡兔同笼, 还原问题, 相遇问题, 行程问题, 人民币问题, 时间问题, 浓度问题, 温度问题, 排列组合, 统计指标, 分数与分数, 分数与小数, 公约数与公倍数, 公约数与倍数, 因数与倍数综合, 质数与合数, 乘法问题, 定义新运算, 方程问题, 除法问题, 估算问题, 百分数问题.
* **Language:** The category labels are in **Chinese**. An English translation is provided in the "Content Details" section.
* **Legend:**
* **Position:** Top-center, above the plot area.
* **Content:** Four entries, each with a colored line and marker:
* **Blue line with circle marker:** Yi-6B
* **Orange line with circle marker:** ChatGLM3-6B
* **Green line with circle marker:** LLaMA2-7B
* **Red line with circle marker:** DeepSeekMath-7B
### Detailed Analysis
**Model Performance Trends (Trend Verification):**
1. **DeepSeekMath-7B (Red Line):**
* **Trend:** Exhibits the highest overall performance, frequently occupying the top position. Its line shows sharp peaks and valleys but maintains a generally high baseline.
* **Key Data Points:** Reaches near-perfect accuracy (~100%) on "鸡兔同笼" (Rabbit and Chicken Cages) and "因数与倍数综合" (Factors and Multiples Comprehensive). Its lowest points are around 20-30% on categories like "归一问题" (Unitary Method) and "归总问题" (Inverse Unitary Method).
2. **ChatGLM3-6B (Orange Line):**
* **Trend:** Often the second-best performer, closely following DeepSeekMath-7B. It shows high volatility, with some categories where it matches or exceeds the red line, and others where it drops significantly.
* **Key Data Points:** Peaks at ~90% on "百分数问题" (Percentage Problems) and ~85% on "平面图形综合" (Plane Figures Comprehensive). Dips to ~20% on "归一问题" (Unitary Method).
3. **Yi-6B (Blue Line):**
* **Trend:** Generally performs in the middle-to-lower range among the four models. Its line is often below the orange and red lines but above the green line.
* **Key Data Points:** Has a notable peak of ~78% on "因数与倍数综合" (Factors and Multiples Comprehensive). Its performance is frequently in the 20-50% range.
4. **LLaMA2-7B (Green Line):**
* **Trend:** Consistently the lowest-performing model across almost all categories. Its line forms the bottom boundary of the data cluster.
* **Key Data Points:** Rarely exceeds 30% accuracy. Its highest point is approximately 30% on "百分数问题" (Percentage Problems). It frequently scores near 0% on multiple categories (e.g., "归一问题", "归总问题", "盈亏问题").
**Category Performance (Spatial Grounding & Data Extraction):**
Performance varies dramatically by category. Here is a sample of translated categories with approximate accuracy values for each model (values are visual estimates):
| Category (Chinese) | Category (English) | Yi-6B (Blue) | ChatGLM3-6B (Orange) | LLaMA2-7B (Green) | DeepSeekMath-7B (Red) |
| :--- | :--- | :--- | :--- | :--- | :--- |
| 三角形 | Triangle | ~40% | ~55% | ~20% | ~70% |
| 圆 | Circle | ~10% | ~25% | ~5% | ~70% |
| 平行四边形 | Parallelogram | ~45% | ~80% | ~25% | ~90% |
| 鸡兔同笼 | Rabbit & Chicken Cages | ~73% | ~87% | ~27% | **~100%** |
| 行程问题 | Travel/Distance Problems | ~30% | ~40% | ~15% | ~50% |
| 百分数问题 | Percentage Problems | ~75% | ~90% | ~30% | ~65% |
| 归一问题 | Unitary Method | ~10% | ~15% | **~0%** | ~20% |
### Key Observations
1. **Clear Performance Hierarchy:** A consistent ranking is visible: DeepSeekMath-7B > ChatGLM3-6B > Yi-6B > LLaMA2-7B across the vast majority of categories.
2. **High Category Sensitivity:** All models show extreme performance variance depending on the problem type. No model is uniformly strong or weak.
3. **Specialized Strengths:** DeepSeekMath-7B shows exceptional strength in specific, likely more complex or structured problem types like "鸡兔同笼" and "因数与倍数综合".
4. **Systematic Weakness in Foundational Methods:** All models, especially LLaMA2-7B, perform poorly on categories like "归一问题" (Unitary Method) and "归总问题" (Inverse Unitary Method), suggesting a common difficulty with these fundamental problem-solving frameworks.
5. **Visual Clustering:** The lines for Yi-6B (Blue) and LLaMA2-7B (Green) are often tightly clustered in the lower half of the chart, while ChatGLM3-6B (Orange) and DeepSeekMath-7B (Red) compete in the upper half.
### Interpretation
This chart provides a comparative benchmark of mathematical reasoning capabilities across four LLMs. The data suggests that **DeepSeekMath-7B is the most capable and robust model for this set of mathematical tasks**, demonstrating both high peak performance and a generally high floor. **ChatGLM3-6B is a strong competitor**, often close in performance.
The **dramatic category-by-category variation** is the most critical insight. It indicates that mathematical problem-solving is not a monolithic skill for these models; their proficiency is highly dependent on the specific type of logic, formula, or reasoning step required. The near-zero scores for LLaMA2-7B on foundational methods like "归一问题" highlight a potential gap in its training data or reasoning architecture for certain algorithmic approaches.
The chart effectively argues that evaluating LLMs on a single "math accuracy" score is insufficient. A granular, category-specific analysis, as presented here, is necessary to understand a model's true strengths and weaknesses, which is crucial for selecting the right model for specific educational, research, or application purposes in quantitative domains. The poor performance of all models on certain categories also points to persistent challenges in AI mathematical reasoning that remain unsolved.
DECODING INTELLIGENCE...