## Histogram: Proof Length Distribution
### Overview
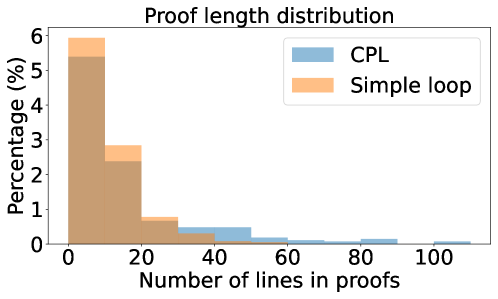
The image is a histogram showing the distribution of proof lengths, measured by the number of lines in proofs. Two different methods, "CPL" and "Simple loop", are compared. The y-axis represents the percentage of proofs, and the x-axis represents the number of lines in proofs.
### Components/Axes
* **Title:** Proof length distribution
* **X-axis:** Number of lines in proofs
* Scale: 0 to 100, with tick marks at 0, 20, 40, 60, 80, and 100.
* **Y-axis:** Percentage (%)
* Scale: 0 to 6, with tick marks at 0, 1, 2, 3, 4, 5, and 6.
* **Legend:** Located in the top-right corner.
* CPL: Represented by light blue bars.
* Simple loop: Represented by light orange bars.
### Detailed Analysis
The histogram displays the frequency distribution of proof lengths for two methods: CPL (light blue) and Simple loop (light orange). The height of each bar indicates the percentage of proofs falling within a specific range of line counts.
**CPL (Light Blue):**
* 0-20 lines: Approximately 5.4%
* 20-40 lines: Approximately 0.4%
* 40-60 lines: Approximately 0.2%
* 60-80 lines: Approximately 0.1%
* 80-100 lines: Approximately 0.1%
* 100-120 lines: Approximately 0.05%
**Simple Loop (Light Orange):**
* 0-20 lines: Approximately 5.9%
* 20-40 lines: Approximately 0.8%
* 40-60 lines: Approximately 0.0%
* 60-80 lines: Approximately 0.0%
* 80-100 lines: Approximately 0.0%
* 100-120 lines: Approximately 0.0%
### Key Observations
* Both methods show a high concentration of proofs with shorter lengths (0-20 lines).
* The "Simple loop" method has a higher percentage of proofs in the 0-20 lines range compared to "CPL".
* As the number of lines increases, the percentage of proofs decreases for both methods.
* The "CPL" method has a slightly more gradual decrease in percentage as the number of lines increases compared to "Simple loop".
### Interpretation
The histogram suggests that both the "CPL" and "Simple loop" methods tend to produce proofs with relatively short lengths. The "Simple loop" method appears to be more heavily skewed towards shorter proofs compared to "CPL". This could indicate that "Simple loop" is more efficient for simpler proofs, while "CPL" might be used or result in slightly longer proofs in some cases. The rapid decrease in percentage for both methods as the number of lines increases suggests that longer proofs are less common, regardless of the method used.