\n
## Chart: Proof Length Distribution
### Overview
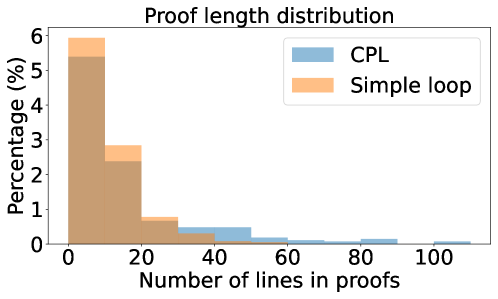
The image presents a histogram illustrating the distribution of proof lengths for two different proof strategies: CPL (Classical Proof Logic) and Simple Loop. The x-axis represents the number of lines in proofs, while the y-axis represents the percentage of proofs falling within specific line-count ranges. The chart visually compares the length of proofs generated by each method.
### Components/Axes
* **Title:** "Proof length distribution" - positioned at the top-center of the chart.
* **X-axis Label:** "Number of lines in proofs" - positioned at the bottom-center. The scale ranges from 0 to 100, with increments of 20.
* **Y-axis Label:** "Percentage (%)" - positioned at the left-center. The scale ranges from 0 to 6, with increments of 1.
* **Legend:** Located in the top-right corner.
* "CPL" - represented by a light blue color.
* "Simple loop" - represented by a light orange/brown color.
### Detailed Analysis
The chart displays two overlapping histograms.
**Simple Loop (Orange/Brown):**
The Simple Loop histogram exhibits a strong peak between 0 and 20 lines, reaching approximately 5.8% at around the 10-line mark. The distribution slopes downward as the number of lines increases, with a noticeable drop after 20 lines. There is a small, secondary peak around 20-40 lines, reaching approximately 3.2%. The percentage of proofs with more than 40 lines decreases rapidly, approaching 0% after 80 lines.
* Approximately 5.8% of Simple Loop proofs have between 0 and 20 lines.
* Approximately 3.2% of Simple Loop proofs have between 20 and 40 lines.
* Approximately 1% of Simple Loop proofs have between 40 and 60 lines.
* Less than 0.5% of Simple Loop proofs have more than 60 lines.
**CPL (Light Blue):**
The CPL histogram is significantly lower in magnitude compared to the Simple Loop histogram. It shows a slight peak between 0 and 20 lines, reaching approximately 0.2%. The distribution decreases rapidly as the number of lines increases. There is a small increase around 40 lines, reaching approximately 0.4%. The percentage remains low for proofs with more than 60 lines.
* Approximately 0.2% of CPL proofs have between 0 and 20 lines.
* Approximately 0.4% of CPL proofs have between 40 and 60 lines.
* Approximately 0.2% of CPL proofs have between 80 and 100 lines.
### Key Observations
* Simple Loop proofs are generally much shorter than CPL proofs.
* The majority of Simple Loop proofs are less than 40 lines long.
* CPL proofs tend to be longer, with a greater proportion exceeding 40 lines.
* The Simple Loop strategy produces a more concentrated distribution of proof lengths, while CPL has a more dispersed distribution.
### Interpretation
The data suggests that the Simple Loop strategy is more efficient in generating shorter proofs compared to CPL. The histogram clearly demonstrates that a significantly larger percentage of Simple Loop proofs fall within the lower range of line counts. This could indicate that Simple Loop is better suited for problems where concise proofs are desired, or that CPL introduces unnecessary complexity in certain cases. The difference in distributions suggests that CPL may require more steps or a more elaborate approach to reach a proof, even for relatively simple problems. The near-zero percentage of CPL proofs under 20 lines suggests that CPL is rarely able to produce very short proofs. The slight increase in CPL proofs around 40 lines could indicate a common level of complexity encountered when using this method.