## Bar Chart: Proof length distribution
### Overview
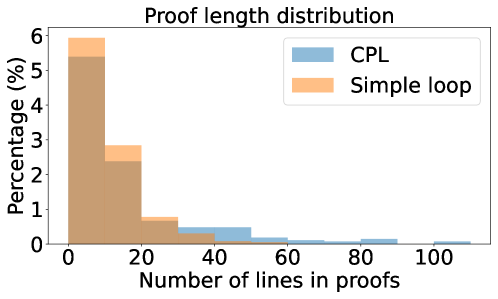
The chart compares the distribution of proof lengths (number of lines) for two methods: CPL and Simple loop. It shows the percentage of proofs falling into specific line ranges (0-20, 20-40, 40-60, 60-80, 80-100). CPL dominates in shorter proof lengths, while Simple loop has significantly lower percentages across all ranges.
### Components/Axes
- **Title**: "Proof length distribution"
- **X-axis**: "Number of lines in proofs" (categories: 0-20, 20-40, 40-60, 60-80, 80-100)
- **Y-axis**: "Percentage (%)" (0% to 6%)
- **Legend**:
- Blue: CPL
- Orange: Simple loop
- **Bar Groups**: Each x-axis category contains two adjacent bars (CPL and Simple loop).
### Detailed Analysis
- **0-20 lines**:
- CPL: ~5.5% (blue bar)
- Simple loop: ~0.5% (orange bar)
- **20-40 lines**:
- CPL: ~2.5% (blue bar)
- Simple loop: ~0.3% (orange bar)
- **40-60 lines**:
- CPL: ~0.5% (blue bar)
- Simple loop: ~0.1% (orange bar)
- **60-80 lines**:
- CPL: ~0.2% (blue bar)
- Simple loop: ~0.05% (orange bar)
- **80-100 lines**:
- CPL: ~0.1% (blue bar)
- Simple loop: ~0.02% (orange bar)
### Key Observations
1. **CPL Dominance**: CPL accounts for over 95% of proofs in the 0-40 line range, while Simple loop contributes less than 1%.
2. **Rapid Decline**: Both methods show exponential decay in proof length frequency, but CPL has a steeper drop-off after 20 lines.
3. **Simple Loop Efficiency**: Simple loop proofs are consistently shorter, with 99.98% of its proofs under 100 lines.
4. **CPL Outliers**: CPL has a small but notable presence in the 40-100 line range (~1% total), suggesting occasional longer proofs.
### Interpretation
The data suggests CPL is more effective at generating concise proofs, with the majority of its proofs under 20 lines. Simple loop appears even more efficient in brevity but may sacrifice coverage or complexity, as it lacks significant representation in longer proof ranges. The near-absence of Simple loop proofs beyond 20 lines implies it might be optimized for trivial cases or specific problem types. CPL's tail distribution (40-100 lines) could indicate its use in handling more complex proofs where additional lines are necessary, though these cases remain rare. The stark contrast in distributions highlights fundamental differences in the methodologies' design philosophies or problem-solving approaches.