## Network Graph: Centralized Hub-and-Spoke Topology
### Overview
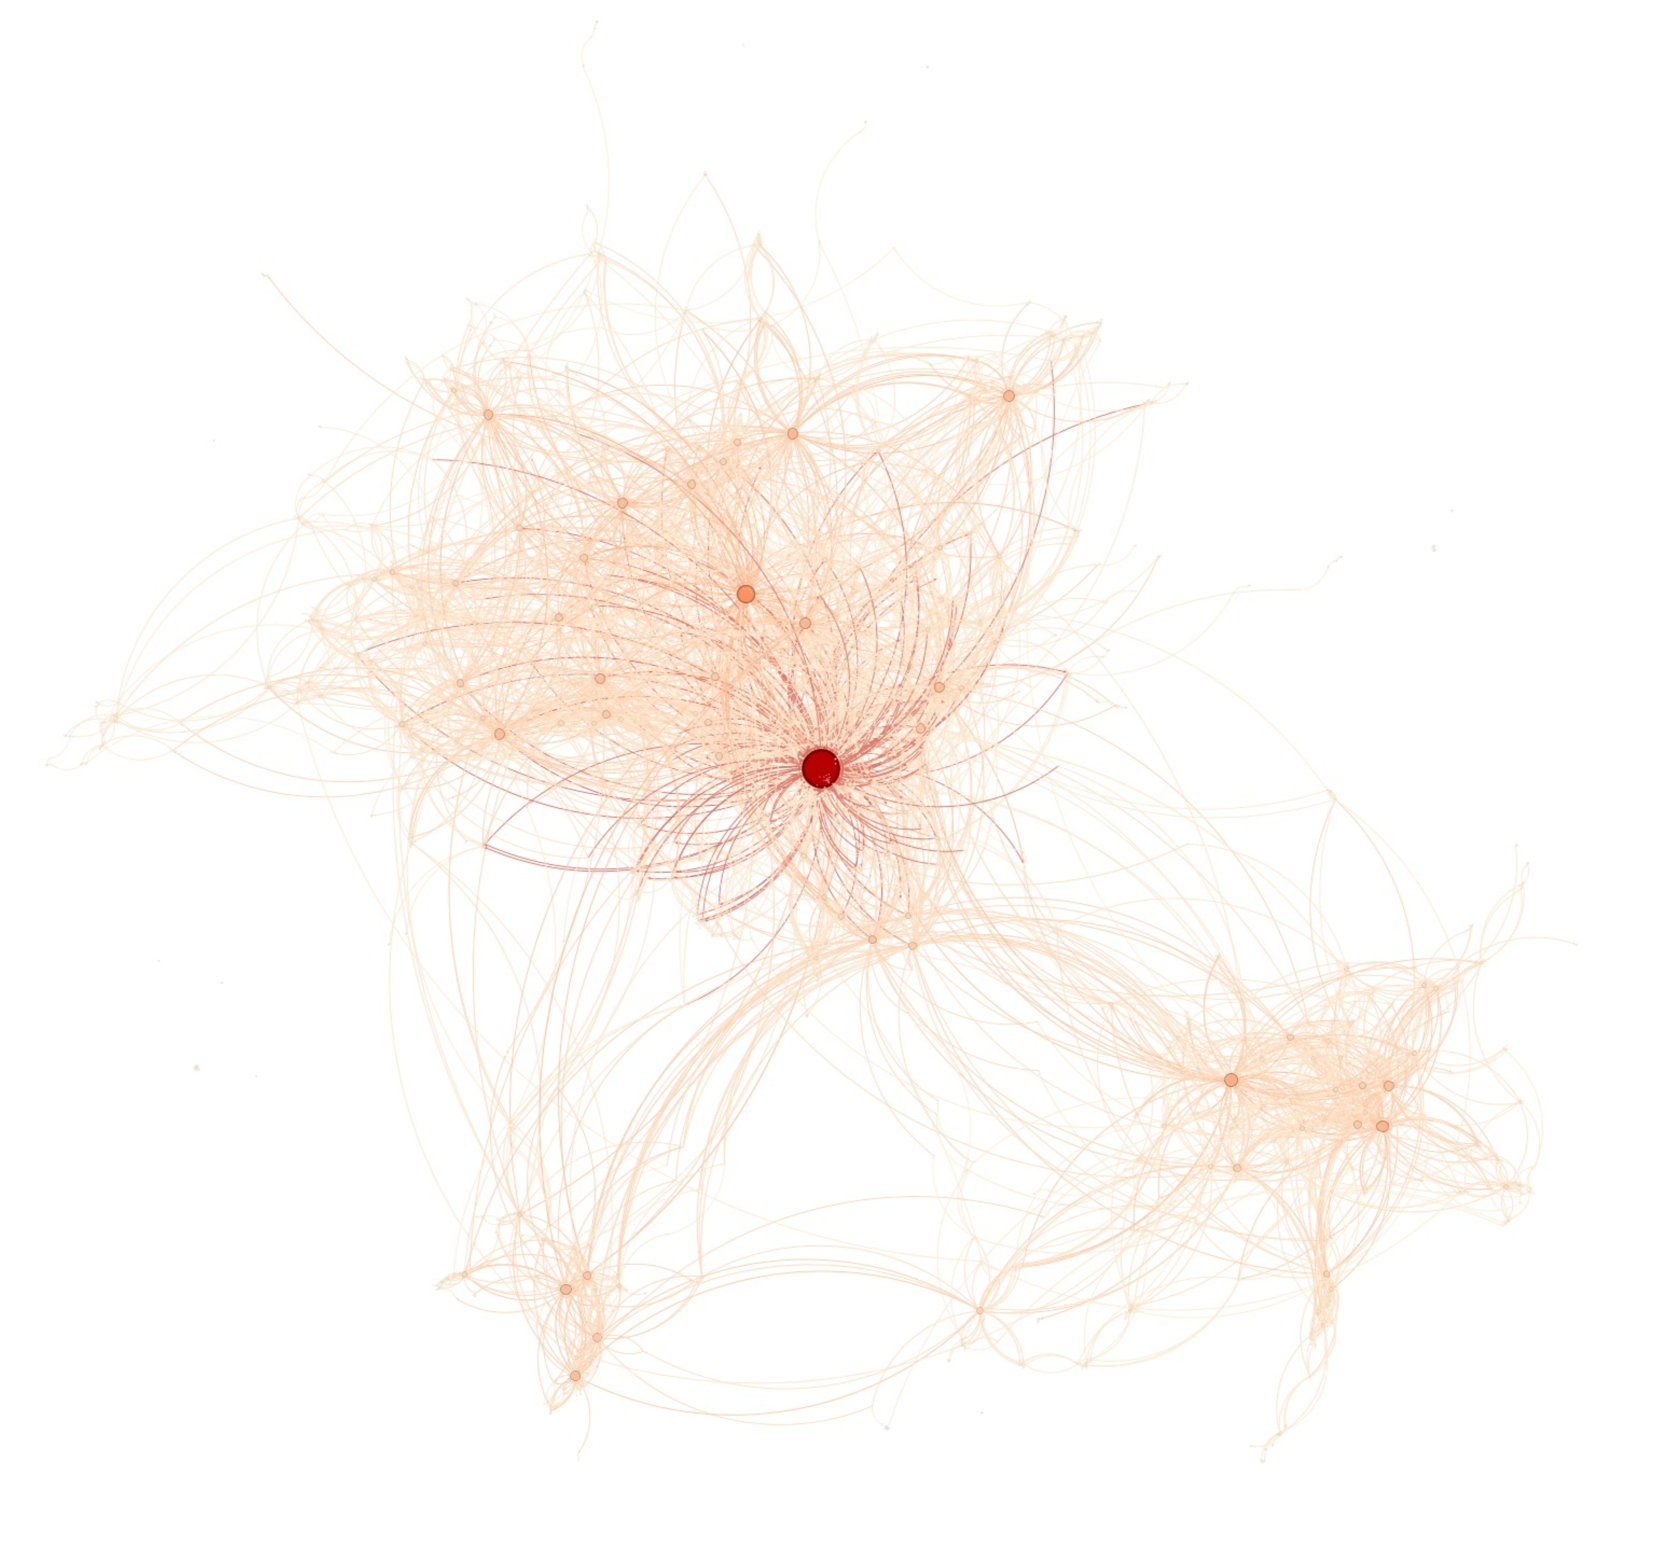
This image is a data visualization of a complex network graph (node-link diagram) displayed against a solid white background. **CRITICAL NOTE: The image contains absolutely no text, labels, axes, legends, or explicit numerical data.** Therefore, no text transcription or exact data table reconstruction is possible. The information contained within this image is entirely structural, relational, and topological, conveyed through the spatial distribution, size, color, and density of nodes (circles) and edges (connecting lines).
### Components & Visual Encoding
Because standard chart axes and legends are absent, the visual encoding must be inferred from the graphical elements:
* **Nodes (Vertices):** Represent individual entities within the network.
* *Size:* Node radius appears to correlate with "degree centrality" (the number of connections it has).
* *Color:* Node color correlates with importance or centrality, ranging from pale peach/translucent (low importance/few connections) to dark, opaque red (high importance/many connections).
* **Edges (Links):** Represent relationships or interactions between nodes.
* *Shape:* Edges are rendered as curved lines (Bezier curves) rather than straight lines, which helps visualize dense connections without them merging into a single solid block.
* *Color/Opacity:* Edges are uniformly pale peach/orange and highly translucent. Density is shown through the overlapping of hundreds of these translucent lines, creating darker, more opaque regions where connections are thickest.
### Detailed Analysis
Applying component isolation, the network can be divided into three primary spatial regions:
**1. The Primary Central Hub (Center / Center-Left)**
* **Positioning:** Dominates the upper-left and central portion of the canvas.
* **Features:** At the exact core of this cluster is a single, prominent, dark red node. This is the largest and darkest element in the entire image.
* **Connectivity:** Hundreds of curved edges radiate outward from this central red node. Many edges loop back to smaller nodes in its immediate vicinity, creating a dense, flower-like or starburst pattern. A few secondary nodes (slightly larger than the background nodes, colored medium-orange) are visible within this primary cluster's orbit.
**2. The Secondary Sub-Hub (Bottom-Right)**
* **Positioning:** Located in the lower right quadrant of the image.
* **Features:** This is a distinct, tightly knit cluster of nodes. It lacks a single massive dominant node like the primary hub, but instead features 3 to 5 medium-sized, light-orange nodes acting as local centers.
* **Connectivity:** It is highly interconnected internally. Crucially, a thick "highway" or bridge of sweeping, curved edges connects this entire cluster back to the Primary Central Hub.
**3. The Tertiary Sub-Hub (Bottom-Left)**
* **Positioning:** Located in the lower left quadrant, directly below the left edge of the primary hub.
* **Features:** The smallest and least dense of the three main clusters. It contains a few slightly enlarged nodes.
* **Connectivity:** It serves as a structural bridge. It has distinct edge pathways connecting upward to the Primary Central Hub, and sweeping edge pathways connecting rightward to the Secondary Sub-Hub.
**4. The Periphery**
* Long, faint, sweeping lines extend outward from the main hubs into the negative white space. Some of these appear to connect to very small, almost invisible nodes at the edges of the graph, while others loop back into the main clusters.
### Key Observations
* **Extreme Centralization:** The visual trend overwhelmingly points to a highly centralized network. The vast majority of paths through the network must pass through or near the single dark red node.
* **Macro-Structure:** The overall shape forms a rough, asymmetrical triangle, with the massive primary hub at the top/center, and the two smaller sub-hubs forming the base at the bottom left and right.
* **Sparsity vs. Density:** The graph utilizes extreme contrast in density. The core of the primary hub is nearly opaque due to overlapping lines, while the spaces between the three main hubs are relatively sparse, crossed only by specific bridging connections.
### Interpretation
While the specific subject matter (e.g., social network, biological pathways, IT infrastructure) is unknown due to the lack of labels, the topological data suggests several strong conclusions:
1. **Scale-Free Network Dynamics:** The graph strongly exhibits properties of a "scale-free" network, which follows a power-law distribution. One node has a massive number of connections (the hub), while the vast majority of nodes have very few. This is typical of organic networks like the internet, social influencer networks, or protein interaction networks.
2. **Single Point of Failure:** From a systems analysis perspective, this network is highly vulnerable. The dark red central node is a critical bottleneck. If that node were removed or failed, the network would likely fragment into isolated, disconnected sub-communities (specifically, the bottom-right and bottom-left clusters would lose their primary routing pathway).
3. **Community Structure:** Despite the overwhelming dominance of the central node, the presence of the bottom-right and bottom-left clusters indicates distinct sub-communities. These communities have strong internal relationships but rely on the central hub for broader network integration. The bottom-left cluster appears to act as an intermediary or secondary routing path between the main hub and the bottom-right hub.