## Network Graph: Structural Topology Visualization
### Overview
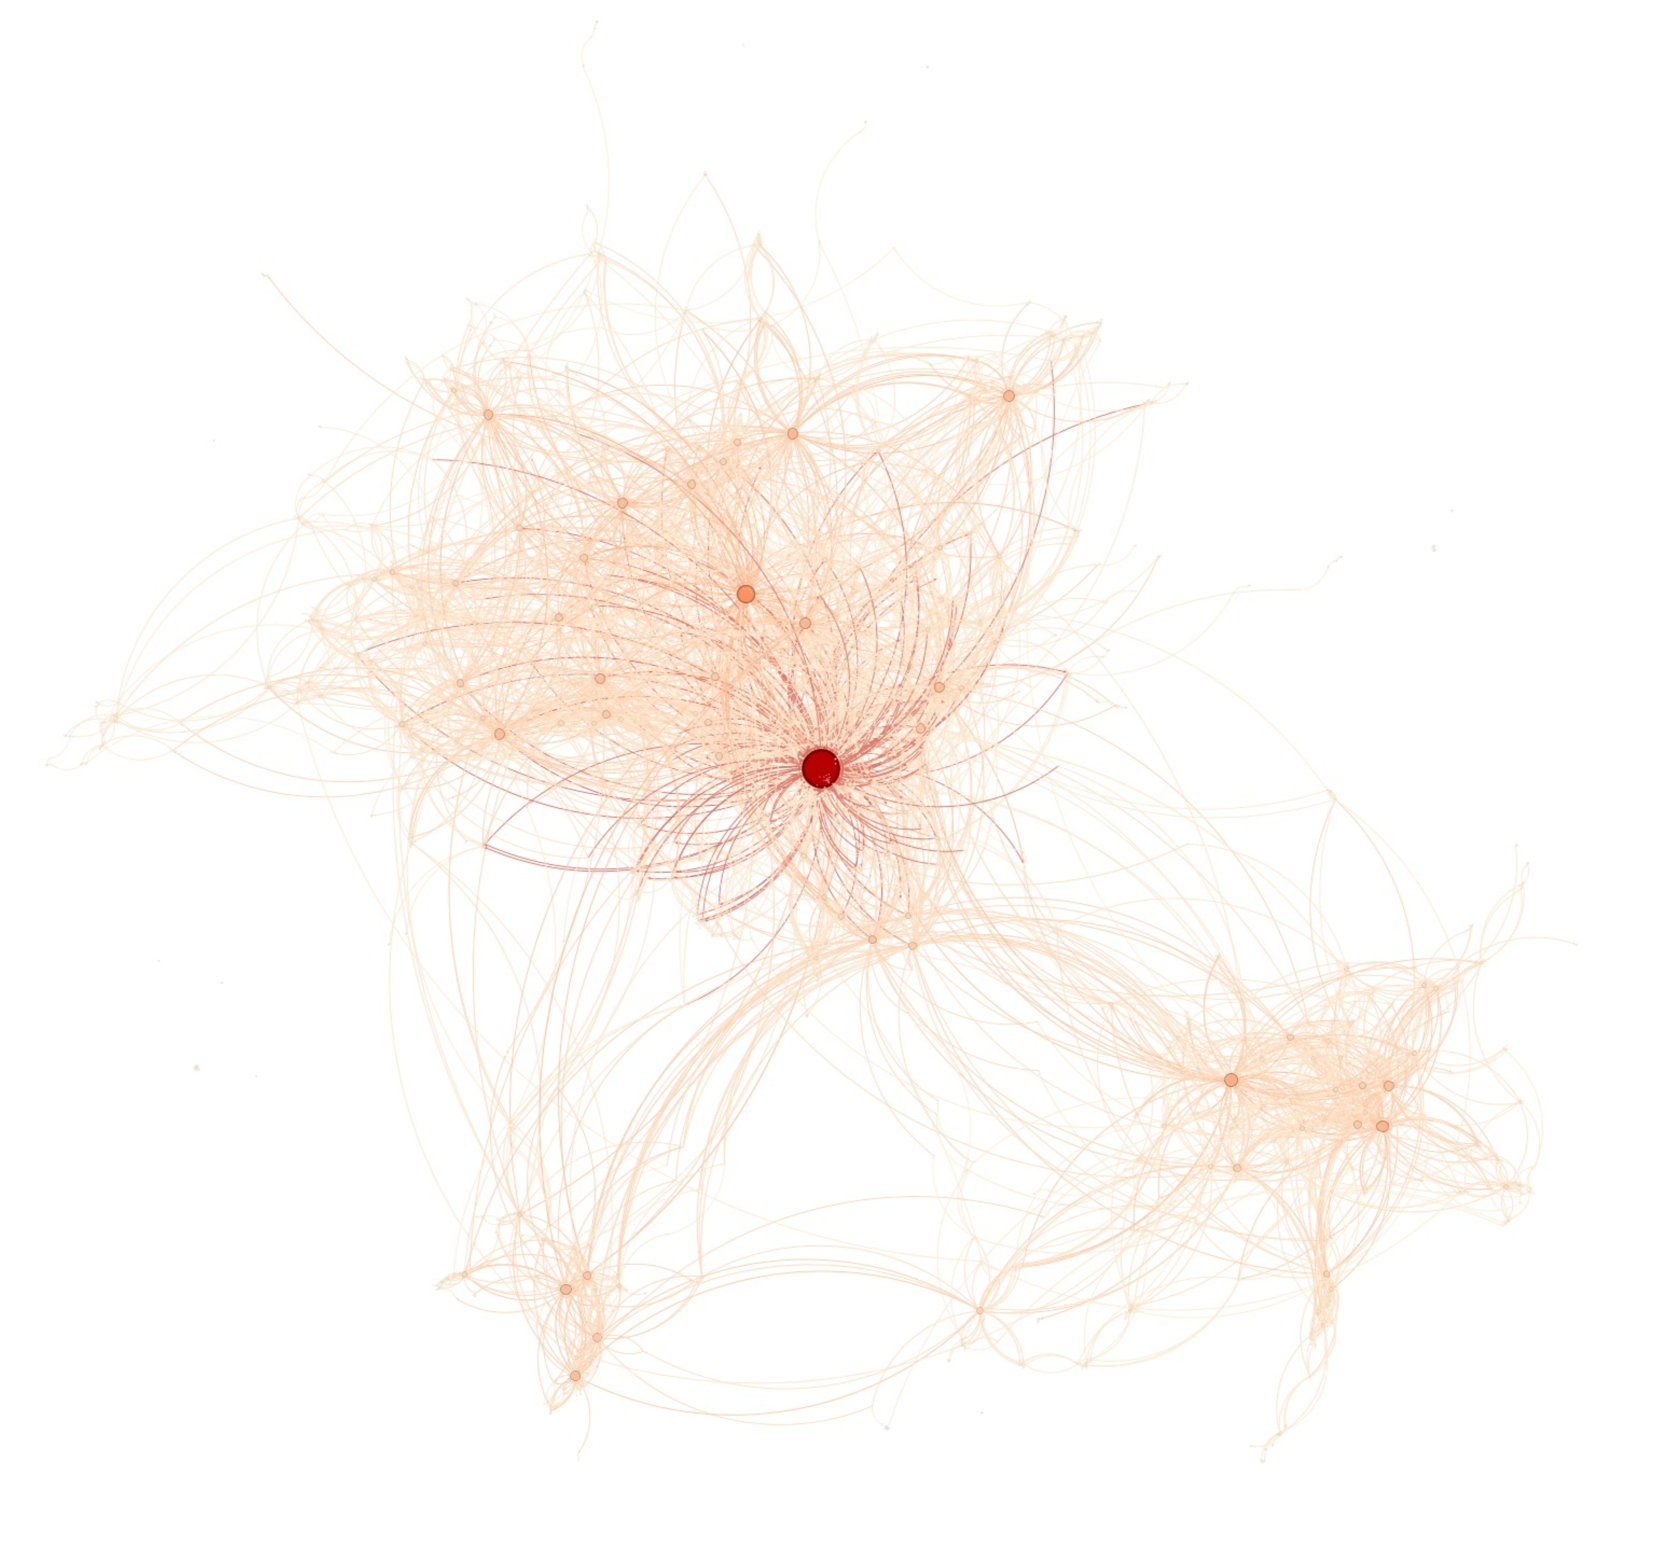
This image is a force-directed network graph representing a system of interconnected nodes and edges. There is no textual information, labels, or legends provided in the image. The visualization depicts a complex, non-linear relationship structure characterized by a primary, highly dense cluster and a secondary, smaller cluster, connected by a bridge of edges. The visual hierarchy is defined by color saturation and node size, with a single, prominent red node acting as the central hub.
### Components/Axes
* **Axes:** None. This is a topological map, not a Cartesian plot.
* **Nodes (Vertices):** Represented by circles of varying sizes.
* **Primary Node:** A single, large, deep-red circle located slightly above the center of the primary cluster.
* **Peripheral Nodes:** Smaller, light-peach/orange circles distributed throughout the graph.
* **Edges (Links):** Represented by thin, curved lines connecting the nodes.
* **Color:** Mostly light peach, with some darker, more saturated lines radiating from the central red node.
* **Legend:** None.
### Detailed Analysis
The image can be segmented into three distinct regions to understand the flow and connectivity:
**1. The Primary Cluster (Upper-Left/Center)**
* **Visual Trend:** This region is characterized by high density. The lines converge heavily toward the center.
* **Central Hub:** A single, large, deep-red node dominates this region. It acts as the focal point of the entire graph.
* **Connectivity:** The edges radiating from this red node are darker and more saturated than the rest of the graph, suggesting a higher "weight" or frequency of connection compared to the peripheral nodes. The density of lines creates a "starburst" or "web" effect.
**2. The Secondary Cluster (Lower-Right)**
* **Visual Trend:** This region is significantly less dense than the primary cluster. It lacks a single dominant hub.
* **Structure:** The nodes here are more loosely connected, forming a smaller, distinct community or sub-network. The edges are uniformly light in color, indicating lower connection weights compared to the primary hub.
**3. The Bridge (Connecting Region 1 and 2)**
* **Visual Trend:** There is a visible "neck" or bridge of edges connecting the primary cluster to the secondary cluster.
* **Flow:** The connectivity between the two clusters appears sparse, suggesting that the two groups are distinct entities that interact through a limited number of pathways.
### Key Observations
* **Bimodal Distribution:** The graph clearly separates into two distinct communities (a large, dense one and a smaller, sparse one).
* **Centrality:** The deep-red node exhibits high "degree centrality," meaning it has the highest number of connections and likely serves as the primary gateway or influencer within this network.
* **Visual Hierarchy:** The use of color saturation (deep red vs. light peach) effectively communicates the importance or activity level of the nodes, even without a legend.
* **Layout Algorithm:** The curved nature of the lines and the clustering suggest the use of a force-directed layout algorithm (such as Fruchterman-Reingold), which positions nodes to minimize edge crossings and maximize visual clarity of clusters.
### Interpretation
This visualization represents a system of relationships, likely social, digital, or biological in nature.
* **System Dynamics:** The data suggests a "hub-and-spoke" model nested within a larger community structure. The red node is the critical point of failure or the primary influencer; if this node were removed, the primary cluster would likely fragment.
* **Community Structure:** The existence of two clusters suggests a "community detection" phenomenon. The primary cluster represents a core group, while the secondary cluster represents a peripheral group or a distinct sub-community that maintains a tenuous link to the core.
* **Peircean Investigative Reading:** The lack of labels implies that the *structure* of the network is the primary information being conveyed, rather than the specific identities of the nodes. The visual "gravity" pulling the lines toward the red node signifies that this node is the "signifier" of the network's activity. The bridge between the two clusters represents the "weak ties" (in sociological terms) that connect otherwise disparate groups, which are often the most critical pathways for information flow between communities.