## Network Diagram: Centralized Hub-and-Spoke Structure
### Overview
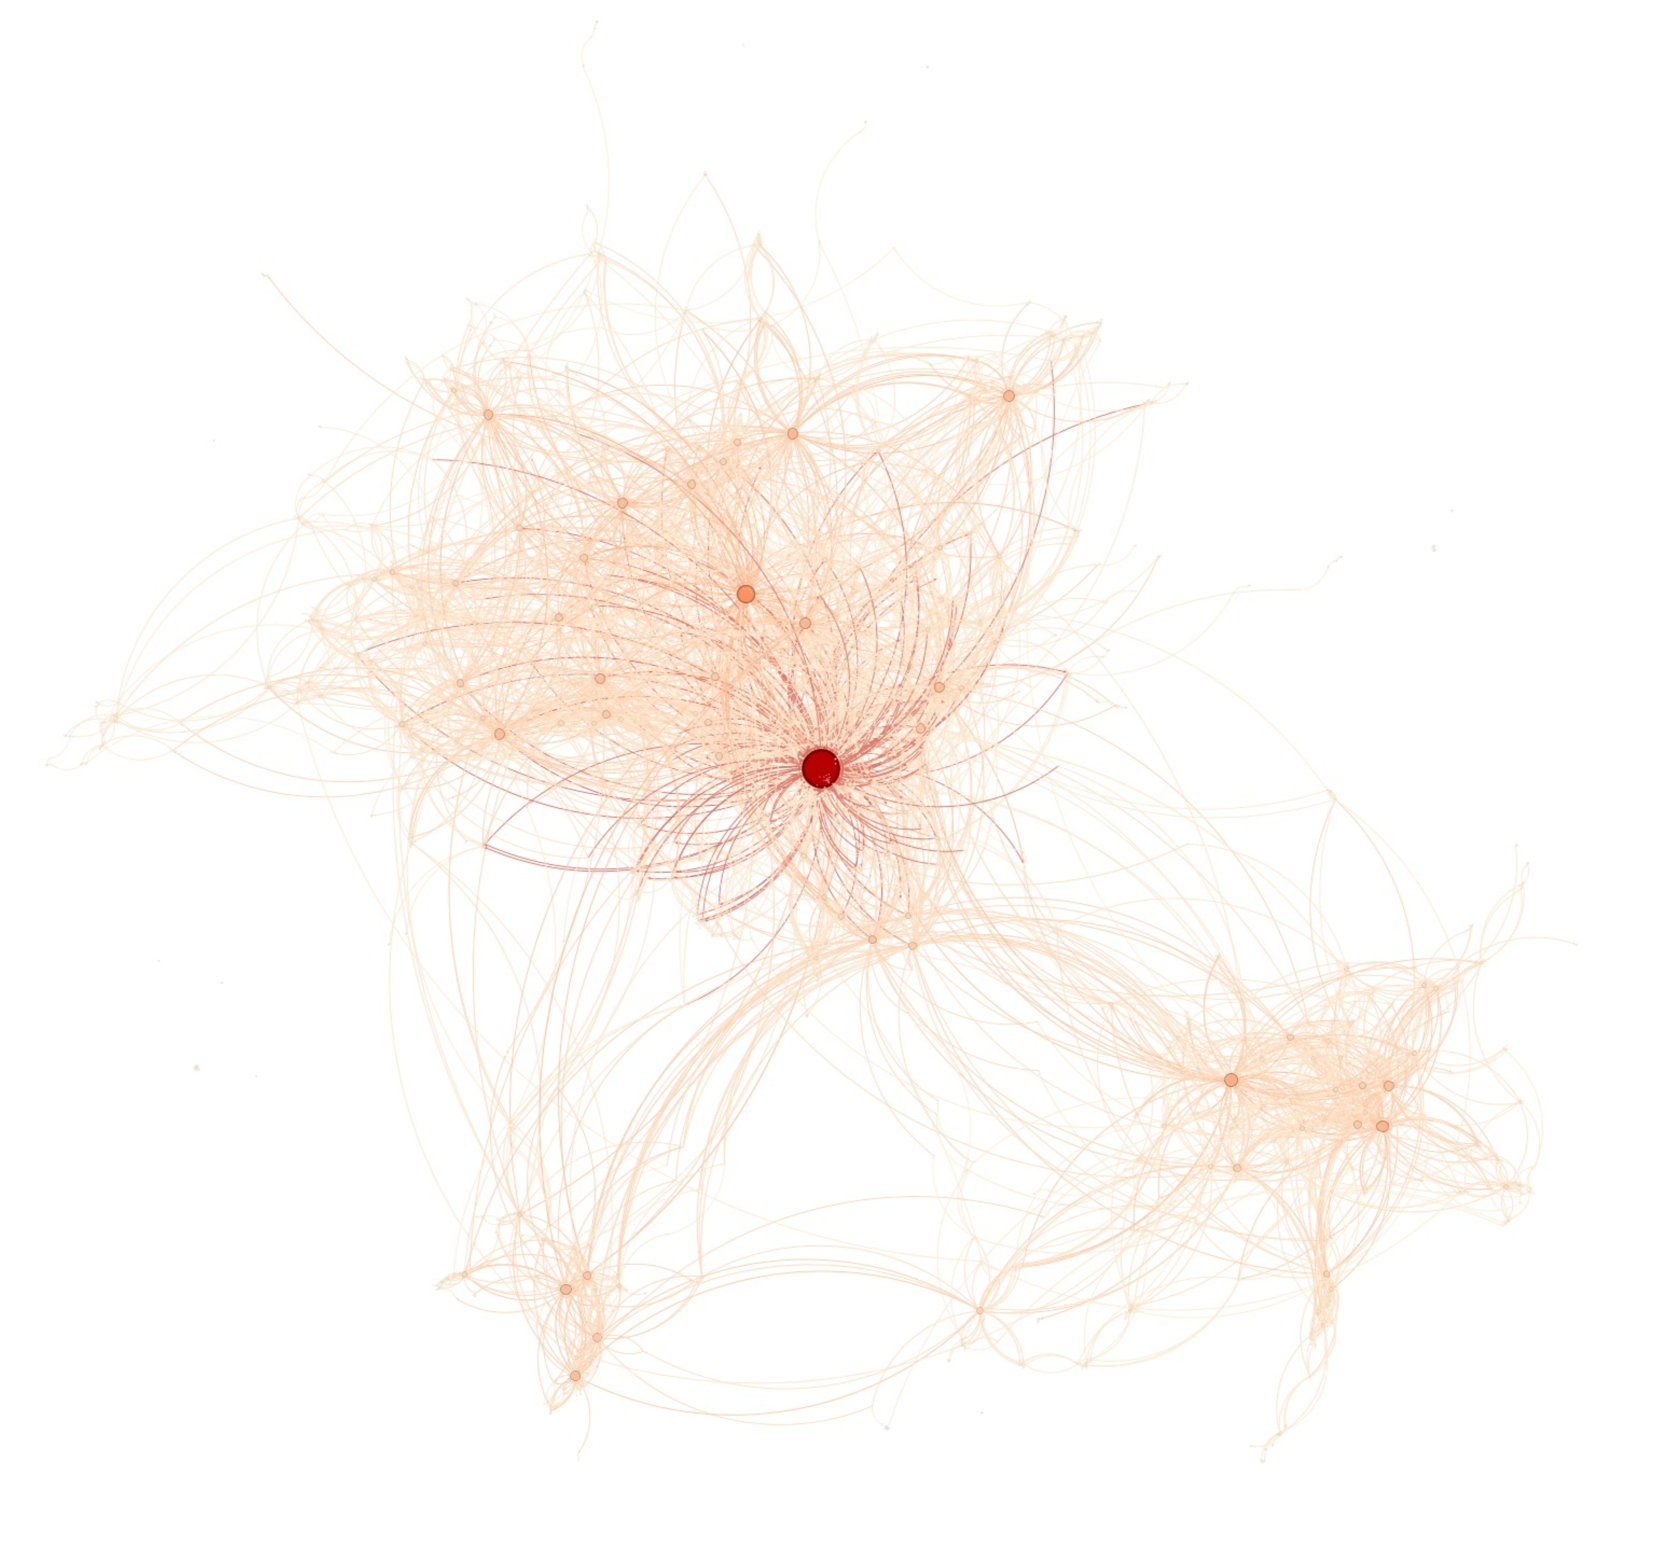
The image displays a complex, abstract network diagram or graph visualization against a plain white background. It consists of numerous nodes (dots) connected by thin, curved lines (edges). The structure is highly centralized, with one dominant, brightly colored node acting as a primary hub, from which a dense web of connections radiates outward to form several distinct clusters. There is no textual information, labels, axes, or legends present in the image.
### Components
* **Nodes:** Represented as circular dots. They vary in size and color saturation.
* **Primary Hub Node:** A single, large, solid **dark red** node located slightly above the geometric center of the main cluster.
* **Secondary Nodes:** Numerous smaller nodes in shades of **light orange, peach, and beige**. These are distributed throughout the diagram, with some forming dense local clusters.
* **Edges:** Represented as thin, curved lines connecting the nodes. They are predominantly in **light orange and beige** tones, with some lines near the central hub appearing slightly darker or more saturated. The lines are not straight; they follow organic, sweeping curves.
* **Spatial Layout:** The network is not uniformly distributed. It features:
* A **dense central cluster** surrounding the red hub node.
* Several **peripheral clusters** connected to the center by longer, sparser lines. Notable clusters are visible in the **bottom-left**, **bottom-right**, and **upper-left** regions of the diagram.
* The overall shape is asymmetrical and organic, resembling a neural network, a root system, or a force-directed graph layout.
### Detailed Analysis
* **Node Distribution & Hierarchy:**
* The **dark red central node** is the largest and most visually prominent element, indicating it is the primary hub or most connected entity in the network.
* Surrounding it is a high-density region of medium-sized **orange nodes**, which are themselves heavily interconnected and also connected to the central hub.
* Further out, the nodes become smaller, lighter in color (beige), and less densely connected, forming semi-autonomous clusters.
* **Connection (Edge) Patterns:**
* **High Density at Core:** The area immediately around the red hub has the highest concentration of edges, creating a near-solid mass of overlapping lines.
* **Radial Flow:** Many lines emanate directly from the central hub to nodes in the inner ring and to key nodes in the peripheral clusters.
* **Inter-Cluster Connections:** Long, curved lines bridge the gaps between the central mass and the outlying clusters (e.g., a distinct bundle of lines connects the center to the bottom-right cluster).
* **Intra-Cluster Connections:** Within each peripheral cluster, nodes are tightly interconnected with short, dense lines, suggesting strong local relationships.
### Key Observations
1. **Clear Central Dominance:** The network has a single, unambiguous focal point (the red node). This is not a decentralized or flat network.
2. **Hierarchical Clustering:** The structure suggests a hierarchy: Primary Hub (red) -> Secondary Hubs (larger orange nodes in the core) -> Peripheral Clusters (groups of smaller beige nodes).
3. **Organic, Non-Geometric Layout:** The use of curved lines and the irregular placement of clusters indicate this is likely a visualization of relational data (e.g., social connections, citation networks, biological pathways) rather than a schematic or technical blueprint.
4. **Absence of Quantitative Data:** There are no numerical values, scales, or labels. The diagram communicates structure and relationship strength (implied by line density and node size) but not precise metrics.
### Interpretation
This diagram visually represents a **centralized network system with a strong core-periphery structure**. The dark red node is the critical point of failure or the primary source/influence within the system. The dense web of connections around it indicates intense interaction, communication, or dependency.
The peripheral clusters likely represent communities, departments, or specialized subgroups that are internally cohesive but rely on connections to the central hub for integration into the larger network. The long, bridging lines are crucial for overall network cohesion; their removal would isolate the clusters.
**What it likely represents:** Without labels, the exact domain is ambiguous, but the pattern is classic for:
* A **social network** with a central influencer or organization.
* A **computer network** with a main server and clustered clients.
* A **biological neural network** or **protein interaction network**.
* A **knowledge graph** with a core concept linked to many related ideas.
**Notable Anomaly:** The complete lack of text is significant. It suggests the image is either a purely aesthetic visualization, a template, or a figure meant to be accompanied by a detailed caption in an external document. The information is entirely encoded in the topology, color, and density of the graph itself.