TECHNICAL ASSET FINGERPRINT
4682d3473d7e3326f9f4585a
Click to view fullscreen
Press ESC or click to close
FOUND IN PAPERS
EXPERT: healer-alpha-free VERSION 1
RUNTIME: free/openrouter/healer-alpha
INTEL_VERIFIED
## Table: Classification of Causal Models and Feasibility Conditions
### Overview
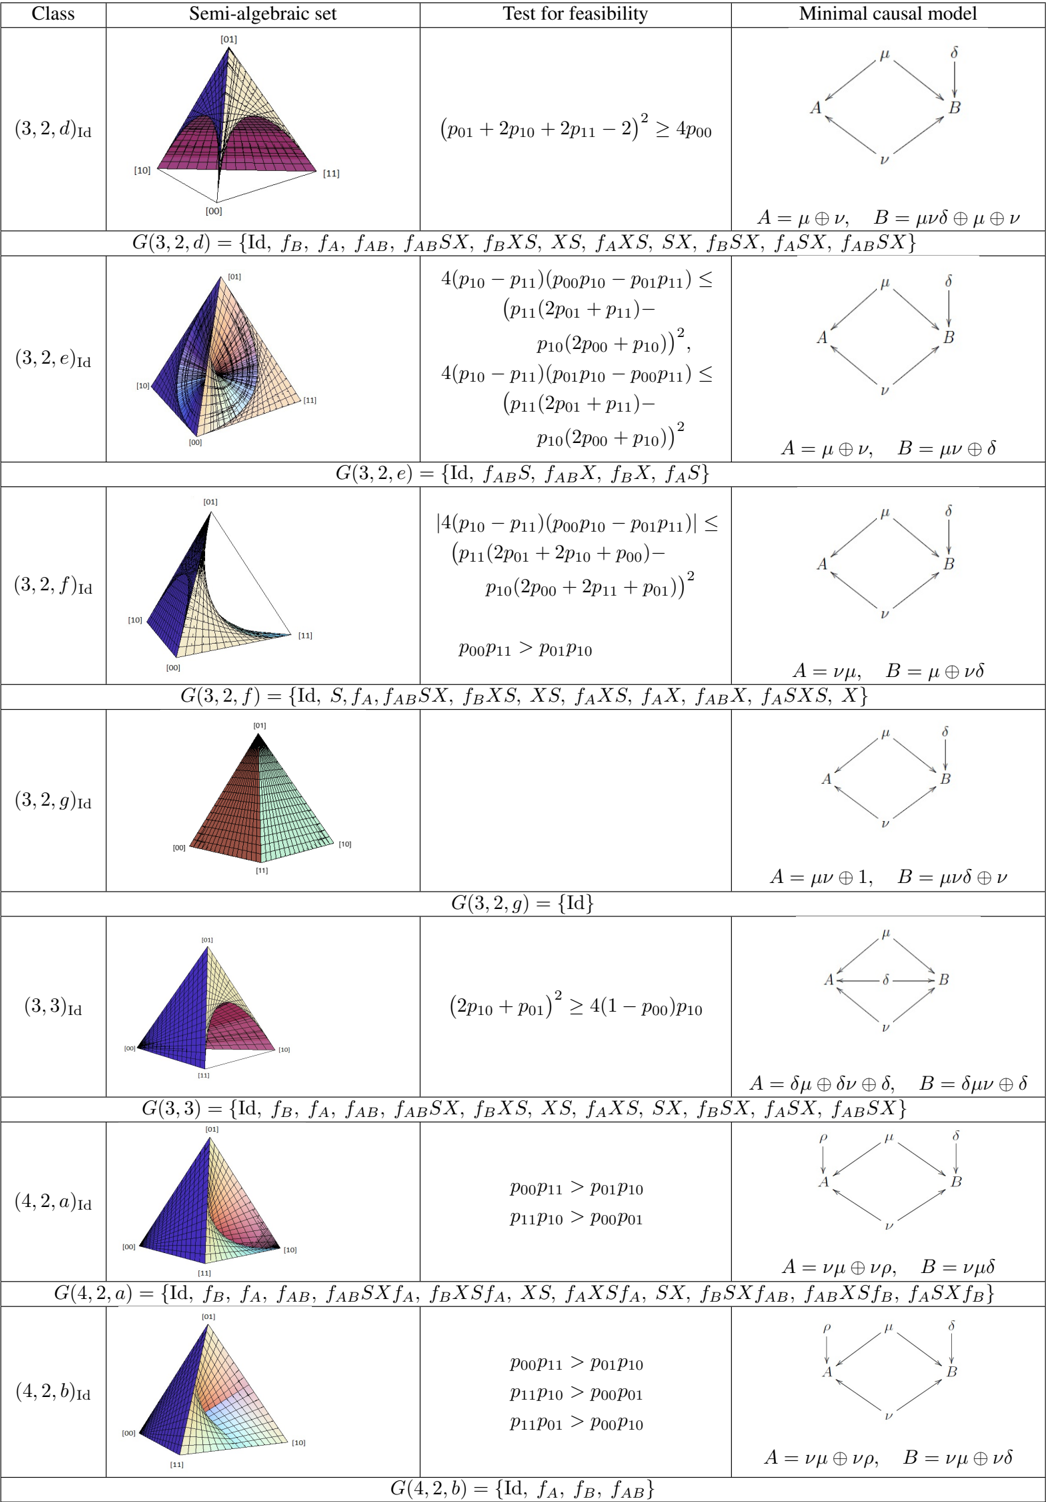
The image is a technical table from a research paper, likely in the field of causal inference, algebraic statistics, or probabilistic graphical models. It classifies different classes of models, each defined by a triplet (e.g., (3,2,d)Id). For each class, it provides: a 3D visualization of a semi-algebraic set, mathematical inequalities that test for feasibility, a diagram of a minimal causal model with associated equations, and a group notation G(...). The table is structured in four columns and seven rows.
### Components/Axes
* **Column 1: Class**: The identifier for each model class (e.g., `(3,2,d)Id`).
* **Column 2: Semi-algebraic set**: A 3D plot visualizing a geometric region, likely within a probability simplex. The plots have vertices labeled `[00]`, `[01]`, `[10]`, and `[11]`.
* **Column 3: Test for feasibility**: Mathematical inequalities involving variables `p00`, `p01`, `p10`, `p11` (presumably joint probabilities for binary variables A and B).
* **Column 4: Minimal causal model**: A directed acyclic graph (DAG) showing relationships between variables (A, B, and latent variables like μ, ν, δ, ρ). Below each graph are equations defining A and B in terms of these latent variables and operations (⊕, which likely denotes XOR or addition modulo 2).
* **Footer Row per Class**: A group notation `G(...)` listing elements like `Id`, `fA`, `fB`, `fAB`, `SX`, `XS`, etc., which likely represent symmetries or transformations of the model.
### Detailed Analysis
The table presents seven distinct classes. Below is a row-by-row extraction.
**Row 1: Class (3,2,d)Id**
* **Semi-algebraic set**: A 3D plot showing a curved, purple-shaded surface within a tetrahedron. The surface appears to bulge outward from the `[00]-[11]` edge.
* **Test for feasibility**: `(p01 + 2p10 + 2p11 - 2)^2 ≥ 4p00`
* **Minimal causal model**: A diamond-shaped DAG. `μ` points to `A`. `ν` points to `A` and `B`. `δ` points to `B`.
* Equations: `A = μ ⊕ ν`, `B = μνδ ⊕ μ ⊕ ν`
* **Group**: `G(3,2,d) = {Id, fB, fA, fAB, fABSX, fBXS, XS, fAXS, SX, fBSX, fASX, fABSX}`
**Row 2: Class (3,2,e)Id**
* **Semi-algebraic set**: A 3D plot with a more complex, twisted surface, shaded in blue and orange. It appears to intersect itself.
* **Test for feasibility**: Two inequalities:
1. `4(p10 - p11)(p00p10 - p01p11) ≤ (p11(2p01 + p11) - p10(2p00 + p10))^2`
2. `4(p10 - p11)(p01p10 - p00p11) ≤ (p11(2p01 + p11) - p10(2p00 + p10))^2`
* **Minimal causal model**: Same diamond DAG structure as Row 1.
* Equations: `A = μ ⊕ ν`, `B = μν ⊕ δ`
* **Group**: `G(3,2,e) = {Id, fABS, fABX, fBX, fAS}`
**Row 3: Class (3,2,f)Id**
* **Semi-algebraic set**: A 3D plot showing a surface that appears to be a curved sheet, shaded in blue and yellow.
* **Test for feasibility**: Two conditions:
1. `|4(p10 - p11)(p00p10 - p01p11)| ≤ (p11(2p01 + 2p10 + p00) - p10(2p00 + 2p11 + p01))^2`
2. `p00p11 > p01p10`
* **Minimal causal model**: Same diamond DAG structure.
* Equations: `A = νμ`, `B = μ ⊕ νδ`
* **Group**: `G(3,2,f) = {Id, S, fA, fABSX, fBXS, XS, fAXS, fA, fAB, fASXS, X}`
**Row 4: Class (3,2,g)Id**
* **Semi-algebraic set**: A 3D plot showing a flat, triangular plane (green) and a curved surface (red/brown) meeting at an edge.
* **Test for feasibility**: The cell is empty, suggesting no additional inequality beyond the class definition.
* **Minimal causal model**: Same diamond DAG structure.
* Equations: `A = μν ⊕ 1`, `B = μνδ ⊕ ν`
* **Group**: `G(3,2,g) = {Id}`
**Row 5: Class (3,3)Id**
* **Semi-algebraic set**: A 3D plot with a purple, saddle-shaped surface.
* **Test for feasibility**: `(2p10 + p01)^2 ≥ 4(1 - p00)p10`
* **Minimal causal model**: A diamond DAG where `δ` points to both `A` and `B` (a common cause).
* Equations: `A = δμ ⊕ δν ⊕ δ`, `B = δμν ⊕ δ`
* **Group**: `G(3,3) = {Id, fB, fA, fAB, fABSX, fBXS, XS, fAXS, SX, fBSX, fASX, fABSX}`
**Row 6: Class (4,2,a)Id**
* **Semi-algebraic set**: A 3D plot with a complex, multi-colored surface (blue, purple, orange).
* **Test for feasibility**: Two inequalities:
1. `p00p11 > p01p10`
2. `p11p10 > p00p01`
* **Minimal causal model**: A diamond DAG with an additional latent variable `ρ` pointing to `A`.
* Equations: `A = νμ ⊕ νρ`, `B = νμδ`
* **Group**: `G(4,2,a) = {Id, fB, fA, fAB, fABSXfA, fBXSfA, XS, fAXSfA, SX, fBSXfAB, fABXSfB, fASXfB}`
**Row 7: Class (4,2,b)Id**
* **Semi-algebraic set**: A 3D plot with a surface shaded in blue, green, and orange.
* **Test for feasibility**: Three inequalities:
1. `p00p11 > p01p10`
2. `p11p10 > p00p01`
3. `p11p01 > p00p10`
* **Minimal causal model**: Same DAG structure as Row 6, with `ρ` pointing to `A`.
* Equations: `A = νμ ⊕ νρ`, `B = νμ ⊕ νδ`
* **Group**: `G(4,2,b) = {Id, fA, fB, fAB}`
### Key Observations
1. **Structural Progression**: The classes progress from simpler models (3,2,...) to more complex ones (4,2,...), with the latter introducing an additional latent parent (`ρ`) for variable A.
2. **Feasibility Conditions**: The mathematical tests become more complex, moving from a single quadratic inequality to multiple product comparisons (`p00p11 > p01p10`).
3. **Causal Diagrams**: The core structure is a diamond DAG. Variations include: the direction of influence from `δ` (to B only vs. to both A and B), and the presence of the extra parent `ρ`.
4. **Group Symmetry**: The group `G(...)` lists shrink dramatically for some classes (e.g., `G(3,2,g)` has only the identity), indicating fewer symmetries or a more constrained model.
5. **Visual Patterns in Plots**: The 3D surfaces represent the geometric region of feasible probability distributions (`p00, p01, p10, p11`) for each class. Their shapes (convex, twisted, planar) visually encode the constraints defined by the inequalities.
### Interpretation
This table is a classification scheme for **binary causal models** under specific assumptions (likely involving latent variables and deterministic relationships, given the ⊕ operations). Each row defines a "class" of models that share a common structure.
* **What the data suggests**: The table maps the relationship between three aspects of a causal model: (1) its **algebraic/geometric footprint** (the semi-algebraic set), (2) its **statistical testability** (the feasibility inequalities), and (3) its **underlying causal mechanism** (the DAG and equations).
* **How elements relate**: The "Class" identifier is the key. For a given class, the DAG defines the causal story. The equations translate that story into a data-generating process. The feasibility inequalities are the necessary and sufficient conditions on observed data (`p` values) for such a causal story to be possible. The 3D plot is a visualization of that feasible set. The group `G` describes the model's invariances.
* **Notable patterns**: The transition from class `(3,2,g)Id` (with an empty feasibility test and a trivial group) to others suggests it might be a boundary or degenerate case. The consistent use of XOR (⊕) implies the models are linear over GF(2), a common simplification in causal discovery literature. The increasing complexity of inequalities for the `(4,2,...)` classes reflects the added flexibility (and identifiability challenges) from the extra latent parent `ρ`.
In essence, this table serves as a **reference catalog** for researchers. It allows them to: given an observed set of binary data, check which causal structures (classes) are feasible; or conversely, given a hypothesized causal DAG, understand the geometric and algebraic constraints it imposes on the data.
DECODING INTELLIGENCE...