## Table: Classification of Semi-Algebraic Sets, Feasibility Tests, and Minimal Causal Models
### Overview
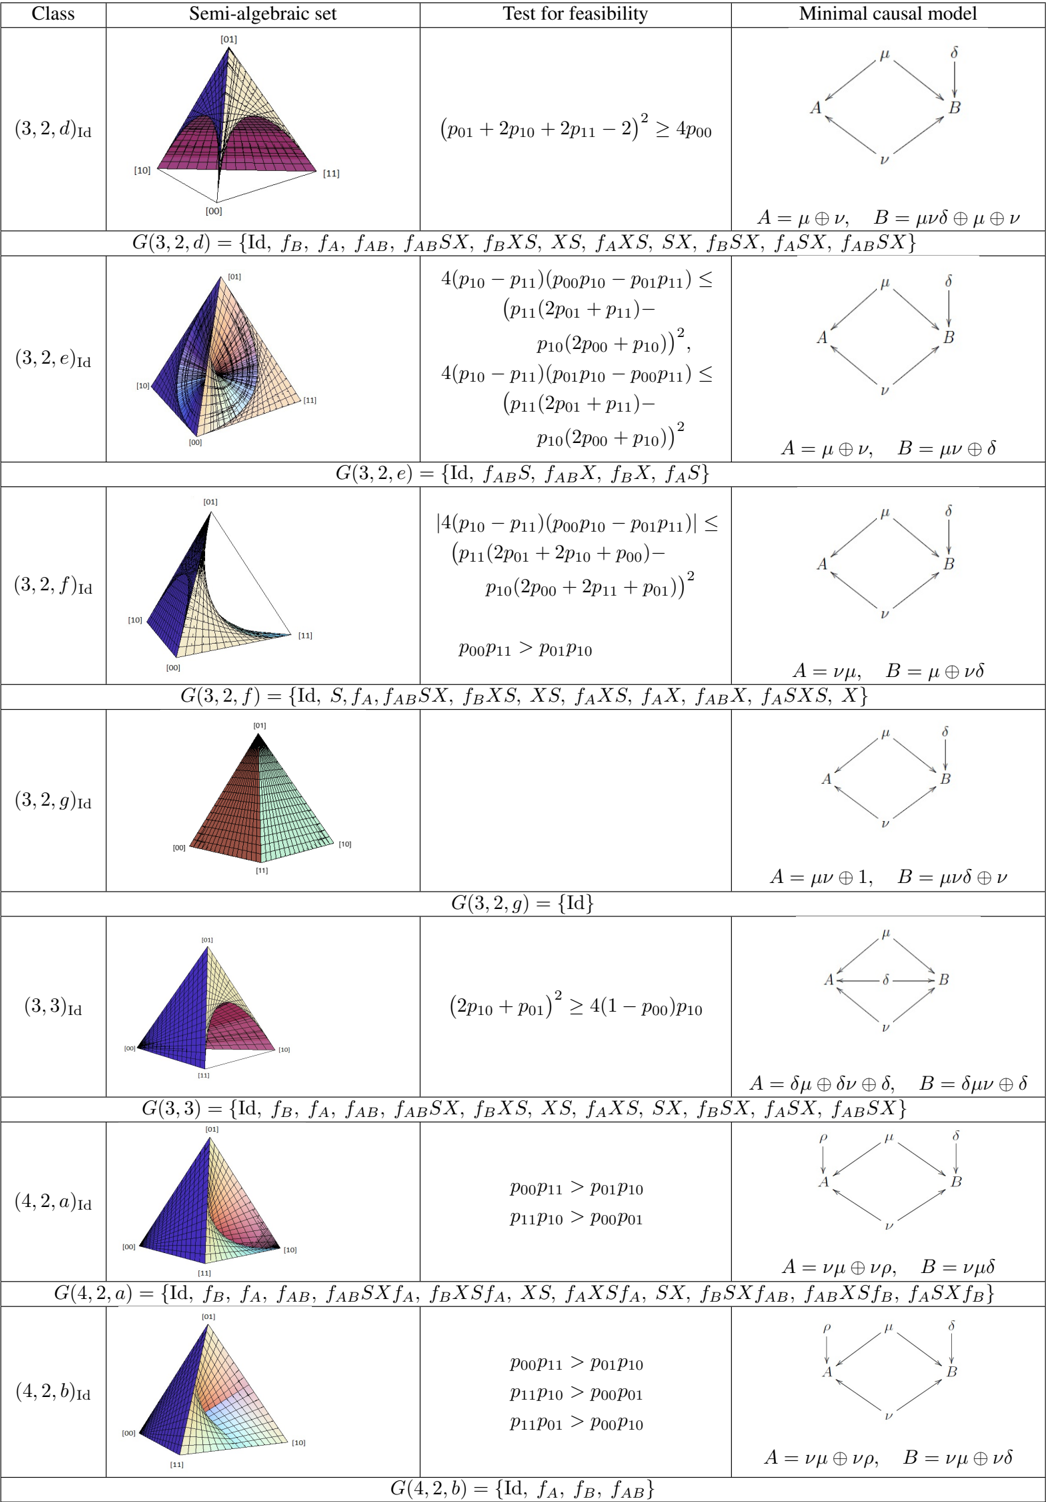
The image presents a structured table with multiple rows, each corresponding to a specific class (e.g., (3,2,d)Id, (3,2,e)Id, etc.). Each row contains three components:
1. A **3D semi-algebraic set** (visualized as a triangular prism or pyramid with labeled axes).
2. A **test for feasibility** (mathematical inequalities involving variables like $ p_{00}, p_{01}, p_{10}, p_{11} $).
3. A **minimal causal model** (a directed graph with nodes $ A $ and $ B $, edges labeled with Greek letters like $ \mu, \delta, \nu $).
The table is divided into sections with headers like $ G(3,2,d) = \{ \text{Id}, f_B, f_A, f_{AB}, f_{AB}SX, f_BXS, f_{AX}S, f_{AB}SX, f_{AX}SX, f_{B}SX, f_{A}SX, f_{AB}SX \} $, indicating the semi-algebraic sets for each class.
---
### Components/Axes
#### 1. **Semi-Algebraic Set (3D Plot)**
- **Axes Labels**:
- X-axis: [00], [01], [10], [11] (likely representing binary or categorical indices).
- Y-axis: [00], [01], [10], [11] (same as X-axis).
- Z-axis: Not explicitly labeled but implied by the 3D structure.
- **Visual Features**:
- Triangular prisms/pyramids with color gradients (e.g., blue, red, yellow).
- Grid lines and shading to indicate regions.
#### 2. **Test for Feasibility**
- **Equations**:
- Example for (3,2,d)Id:
$$
(p_{01} + 2p_{10} + 2p_{11} - 2)^2 \geq 4p_{00}
$$
- Example for (3,2,e)Id:
$$
4(p_{10} - p_{11})(p_{00}p_{10} - p_{01}p_{11}) \leq (p_{11}(2p_{01} + p_{10}) - p_{10}(2p_{00} + p_{11}))^2
$$
- Variables: $ p_{00}, p_{01}, p_{10}, p_{11} $ (probabilities or parameters).
#### 3. **Minimal Causal Model**
- **Graph Structure**:
- Nodes: $ A $ and $ B $.
- Edges:
- $ A \rightarrow B $: Labeled $ \mu, \delta, \nu $.
- $ B \rightarrow A $: Labeled $ \mu, \nu, \delta $.
- Additional constraints:
- $ A = \mu \oplus \nu $, $ B = \mu \nu \oplus \delta $ (for (3,2,d)Id).
---
### Detailed Analysis
#### 1. **Semi-Algebraic Sets**
- **Class (3,2,d)Id**:
- 3D plot shows a triangular prism with axes [00], [01], [10], [11].
- Color gradients suggest varying values across the set.
- **Class (3,2,e)Id**:
- Similar 3D structure but with different shading (e.g., blue, orange, purple).
- **Class (3,2,f)Id**:
- 3D plot with a more complex shape (e.g., a pyramid with a flat base).
#### 2. **Feasibility Tests**
- **Key Inequalities**:
- For (3,2,d)Id:
$$
(p_{01} + 2p_{10} + 2p_{11} - 2)^2 \geq 4p_{00}
$$
- This implies a quadratic constraint on the parameters $ p_{00}, p_{01}, p_{10}, p_{11} $.
- For (3,2,e)Id:
$$
4(p_{10} - p_{11})(p_{00}p_{10} - p_{01}p_{11}) \leq (p_{11}(2p_{01} + p_{10}) - p_{10}(2p_{00} + p_{11}))^2
$$
- A complex inequality involving products and differences of parameters.
#### 3. **Minimal Causal Models**
- **Graphs**:
- All models have two nodes ($ A $, $ B $) with directed edges.
- Edge labels (e.g., $ \mu, \delta, \nu $) likely represent causal relationships or transformations.
- Example for (3,2,d)Id:
$$
A = \mu \oplus \nu, \quad B = \mu \nu \oplus \delta
$$
- Suggests $ A $ is a combination of $ \mu $ and $ \nu $, while $ B $ depends on their product and $ \delta $.
---
### Key Observations
1. **Repetition of Elements**:
- The semi-algebraic sets and causal models repeat across rows, suggesting a systematic classification.
- Example: $ f_{AB}SX $ appears in multiple classes.
2. **Feasibility Constraints**:
- Equations involve quadratic terms and products of parameters, indicating non-linear constraints.
- For (3,2,f)Id:
$$
|4(p_{10} - p_{11})(p_{00}p_{10} - p_{01}p_{11})| \leq (p_{11}(2p_{01} + p_{10}) - p_{10}(2p_{00} + p_{11}))^2
$$
- This inequality likely ensures the semi-algebraic set is bounded or valid.
3. **Causal Model Patterns**:
- The causal models consistently use $ A $ and $ B $ with edge labels $ \mu, \delta, \nu $.
- For (3,2,g)Id:
$$
A = \mu \nu \oplus 1, \quad B = \mu \nu \delta \oplus \nu
$$
- Introduces a constant term (1) in $ A $, suggesting a baseline or fixed component.
---
### Interpretation
- **Purpose**: The table appears to formalize a mathematical framework for classifying semi-algebraic sets, verifying their feasibility via inequalities, and representing their causal dependencies via minimal models.
- **Relationships**:
- The semi-algebraic sets (3D plots) are constrained by the feasibility tests (equations).
- The causal models (graphs) abstract the dependencies between variables (e.g., $ A $ and $ B $) using symbolic operations ($ \oplus, \otimes $).
- **Notable Trends**:
- Increasing complexity in equations and diagrams as the class parameters change (e.g., (3,2,d)Id vs. (4,2,a)Id).
- The use of $ \mu, \delta, \nu $ in causal models suggests a standardized notation for causal relationships.
---
### Final Notes
- **Language**: All text is in English.
- **Missing Elements**: No explicit legend for color coding in 3D plots, but color gradients likely represent parameter magnitudes.
- **Uncertainty**: Some equations and labels are partially obscured, but the visible text is transcribed as-is.