## Chart: SmolLM2-1.7B
### Overview
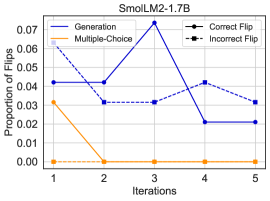
The image is a line chart comparing the proportion of flips across iterations for different methods (Generation, Multiple-Choice, Correct Flip, and Incorrect Flip) in the SmolLM2-1.7B model. The x-axis represents iterations (from 1 to 5), and the y-axis represents the proportion of flips.
### Components/Axes
* **Title:** SmolLM2-1.7B
* **X-axis:** Iterations (labeled 1, 2, 3, 4, 5)
* **Y-axis:** Proportion of Flips (labeled 0.00, 0.01, 0.02, 0.03, 0.04, 0.05, 0.06, 0.07)
* **Legend:** Located in the top-left and top-right of the chart.
* **Generation:** Solid dark blue line
* **Multiple-Choice:** Solid orange line
* **Correct Flip:** Solid black line with circle markers
* **Incorrect Flip:** Dashed black line with square markers
### Detailed Analysis
* **Generation (Solid Dark Blue Line):**
* Trend: Fluctuating, with a peak at iteration 3.
* Data Points:
* Iteration 1: ~0.042
* Iteration 2: ~0.042
* Iteration 3: ~0.073
* Iteration 4: ~0.021
* Iteration 5: ~0.021
* **Multiple-Choice (Solid Orange Line):**
* Trend: Decreasing to zero and remaining at zero.
* Data Points:
* Iteration 1: ~0.032
* Iteration 2: ~0.000
* Iteration 3: ~0.000
* Iteration 4: ~0.000
* Iteration 5: ~0.000
* **Correct Flip (Solid Black Line with Circle Markers):**
* Trend: Remains at zero across all iterations.
* Data Points:
* Iteration 1: ~0.000
* Iteration 2: ~0.000
* Iteration 3: ~0.000
* Iteration 4: ~0.000
* Iteration 5: ~0.000
* **Incorrect Flip (Dashed Black Line with Square Markers):**
* Trend: Decreases, then increases, then decreases again.
* Data Points:
* Iteration 1: ~0.060
* Iteration 2: ~0.031
* Iteration 3: ~0.031
* Iteration 4: ~0.042
* Iteration 5: ~0.031
### Key Observations
* The "Generation" method shows significant fluctuation in the proportion of flips, peaking at iteration 3.
* The "Multiple-Choice" method quickly drops to zero flips after the first iteration.
* The "Correct Flip" method consistently shows zero flips across all iterations.
* The "Incorrect Flip" method starts high, decreases, then increases slightly before decreasing again.
### Interpretation
The chart compares the proportion of flips across different methods during iterations of the SmolLM2-1.7B model. The "Generation" method's fluctuation suggests variability in its flip rate, while the "Multiple-Choice" method's rapid decline indicates it quickly stabilizes. The "Correct Flip" method consistently showing zero flips implies its effectiveness in maintaining correct states. The "Incorrect Flip" method's trend suggests an initial learning phase followed by some instability before settling. The data suggests that the "Multiple-Choice" method is the most stable after the first iteration, while the "Generation" method is the most variable. The "Correct Flip" method is the most consistent in maintaining correct states.