\n
## Line Chart: Proportion of Flips vs. Iterations for SmolLM2-1.7B
### Overview
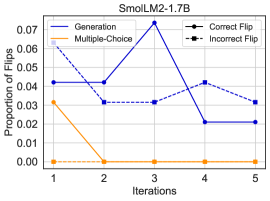
This line chart depicts the proportion of flips observed across different iterations for the SmolLM2-1.7B model. The chart compares the performance of "Generation", "Multiple-Choice", "Correct Flip", and "Incorrect Flip" methods. The x-axis represents the iteration number (1 to 5), and the y-axis represents the proportion of flips, ranging from 0 to 0.07.
### Components/Axes
* **Title:** SmolLM2-1.7B (positioned at the top-center)
* **X-axis Label:** Iterations (positioned at the bottom-center)
* **Y-axis Label:** Proportion of Flips (positioned at the left-center)
* **Legend:** Located at the top-right corner, containing the following labels and corresponding colors:
* Generation (Blue) - Solid Line
* Multiple-Choice (Orange) - Solid Line
* Correct Flip (Black) - Solid Line with Circle Markers
* Incorrect Flip (Purple/Dark Blue) - Dashed Line with Circle Markers
### Detailed Analysis
The chart displays five iterations on the x-axis, labeled 1 through 5. The y-axis shows the proportion of flips, with gridlines at 0.01 intervals.
* **Generation (Blue):** The line starts at approximately 0.065, decreases to around 0.04 at iteration 2, sharply increases to a peak of approximately 0.07 at iteration 3, then declines to around 0.02 at iteration 4, and remains relatively stable at approximately 0.02 at iteration 5.
* **Multiple-Choice (Orange):** The line begins at approximately 0.03, rapidly decreases to near 0 at iteration 2, and remains at approximately 0 for iterations 3, 4, and 5.
* **Correct Flip (Black):** The line starts at approximately 0.04, decreases to around 0.03 at iteration 2, increases to approximately 0.035 at iteration 3, rises to approximately 0.04 at iteration 4, and decreases slightly to approximately 0.035 at iteration 5.
* **Incorrect Flip (Purple/Dark Blue):** The line begins at approximately 0.03, decreases to around 0.03 at iteration 2, increases to approximately 0.035 at iteration 3, rises to approximately 0.04 at iteration 4, and decreases slightly to approximately 0.03 at iteration 5.
Approximate Data Points:
| Iteration | Generation | Multiple-Choice | Correct Flip | Incorrect Flip |
|---|---|---|---|---|
| 1 | 0.065 | 0.03 | 0.04 | 0.03 |
| 2 | 0.04 | 0.00 | 0.03 | 0.03 |
| 3 | 0.07 | 0.00 | 0.035 | 0.035 |
| 4 | 0.02 | 0.00 | 0.04 | 0.04 |
| 5 | 0.02 | 0.00 | 0.035 | 0.03 |
### Key Observations
* The "Generation" method exhibits the most significant fluctuations in the proportion of flips, peaking at iteration 3.
* The "Multiple-Choice" method shows a rapid and substantial decrease in the proportion of flips, reaching near-zero levels after the first iteration.
* "Correct Flip" and "Incorrect Flip" show relatively stable proportions of flips throughout the iterations, with minor variations.
* The "Multiple-Choice" method appears to converge to a very low flip rate quickly.
### Interpretation
The data suggests that the "Generation" method is more sensitive to the iteration process, experiencing larger changes in the proportion of flips compared to other methods. The rapid decline in the "Multiple-Choice" method's flip rate indicates that it quickly stabilizes or converges to a consistent state. The relatively stable flip rates for "Correct Flip" and "Incorrect Flip" suggest that these methods are less affected by the iteration process.
The differences in behavior between the methods could be due to variations in their underlying mechanisms or the types of errors they are prone to. The peak in the "Generation" method's flip rate at iteration 3 might indicate a period of exploration or adjustment before settling into a more stable pattern. The overall trend suggests that the model is learning and adapting over iterations, as evidenced by the changes in the proportion of flips. The SmolLM2-1.7B model appears to be performing better with the Multiple-Choice method, as the proportion of flips is very low after the first iteration.