## Line Chart: SmolLM2-1.7B - Proportion of Flips Over Iterations
### Overview
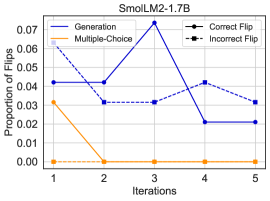
This is a line chart titled "SmolLM2-1.7B" that plots the "Proportion of Flips" against "Iterations" for four distinct data series. The chart tracks changes across five discrete iteration points (1 through 5). The visual style uses a white background with a light gray grid, solid and dashed lines, and distinct markers for each series.
### Components/Axes
* **Title:** "SmolLM2-1.7B" (centered at the top).
* **Y-Axis:** Labeled "Proportion of Flips". The scale runs from 0.00 to 0.07, with major tick marks at intervals of 0.01 (0.00, 0.01, 0.02, 0.03, 0.04, 0.05, 0.06, 0.07).
* **X-Axis:** Labeled "Iterations". The scale shows discrete integer values: 1, 2, 3, 4, 5.
* **Legend:** Positioned in the top-right corner of the chart area. It defines four series:
1. **Generation:** Solid blue line.
2. **Multiple-Choice:** Solid orange line.
3. **Correct Flip:** Dashed blue line with circular markers.
4. **Incorrect Flip:** Dashed black line with square markers.
### Detailed Analysis
**Data Series and Approximate Values:**
1. **Generation (Solid Blue Line):**
* **Trend:** Starts at a moderate level, remains flat, spikes sharply to a peak, then drops significantly and plateaus.
* **Data Points:**
* Iteration 1: ~0.04
* Iteration 2: ~0.04
* Iteration 3: ~0.07 (Peak)
* Iteration 4: ~0.02
* Iteration 5: ~0.02
2. **Multiple-Choice (Solid Orange Line):**
* **Trend:** Starts at a moderate level, then drops to zero and remains there.
* **Data Points:**
* Iteration 1: ~0.03
* Iteration 2: 0.00
* Iteration 3: 0.00
* Iteration 4: 0.00
* Iteration 5: 0.00
3. **Correct Flip (Dashed Blue Line with Circles):**
* **Trend:** Shows a slight dip followed by a recovery and a final minor decline. It generally hovers in the 0.03-0.04 range.
* **Data Points:**
* Iteration 1: ~0.04
* Iteration 2: ~0.03
* Iteration 3: ~0.03
* Iteration 4: ~0.04
* Iteration 5: ~0.03
4. **Incorrect Flip (Dashed Black Line with Squares):**
* **Trend:** Starts as the highest value, drops sharply, then fluctuates slightly around a lower level.
* **Data Points:**
* Iteration 1: ~0.06 (Highest initial value)
* Iteration 2: ~0.03
* Iteration 3: ~0.03
* Iteration 4: ~0.04
* Iteration 5: ~0.03
### Key Observations
* **Peak Anomaly:** The "Generation" series exhibits a dramatic, isolated peak at Iteration 3 (0.07), which is the highest single value recorded on the chart.
* **Zero Plateau:** The "Multiple-Choice" series drops to exactly 0.00 at Iteration 2 and shows no activity for the remainder of the tracked iterations.
* **Convergence:** By Iteration 5, three of the four series ("Correct Flip", "Incorrect Flip", and "Generation") converge within a narrow band between 0.02 and 0.03.
* **Initial Dominance:** At the start (Iteration 1), "Incorrect Flip" has the highest proportion, followed by "Generation" and "Correct Flip" (tied), with "Multiple-Choice" being the lowest.
### Interpretation
The chart appears to track the behavior of a language model (SmolLM2-1.7B) across iterative steps, likely during a training, fine-tuning, or evaluation process involving "flips" (which could refer to changes in model predictions, outputs, or internal states).
* **The "Generation" Spike:** The sharp peak at Iteration 3 suggests a significant event or phase in the process where the proportion of flips related to "Generation" surged. This could indicate a period of high instability, a targeted intervention, or a specific test condition applied at that iteration.
* **Cessation of "Multiple-Choice" Activity:** The drop to zero for "Multiple-Choice" flips after the first iteration implies that this particular type of flip was either resolved, became irrelevant, or was no longer measured after the initial step.
* **Stability of Flip Types:** The "Correct Flip" and "Incorrect Flip" series show relative stability after an initial adjustment (Iteration 1 to 2). Their values remain comparable, suggesting a consistent balance between correct and incorrect flip events throughout most of the process.
* **Process Convergence:** The convergence of multiple series by Iteration 5 may indicate that the system is reaching a steady state or that the iterative process is concluding, with different flip metrics settling into a similar, low-proportion range.
**Language:** All text in the image is in English.